In my home lab, I’ve been pretty happy with the vCenter Server ‘Tiny’ appliance deployment size. For the most part, vSphere Web Client performance has been decent and the appliance doesn’t need a lot of RAM or vCPUs.
When I most recently upgraded my lab, I considered using a ‘Small’ deployment but really didn’t want to tie up 16GB of memory – especially with only a small handful of hosts and many services offloaded to an external PSC
Although things worked well for the most part, I had recently been getting vCenter alarms and would get occasional periods of slow refreshes and other oddities.
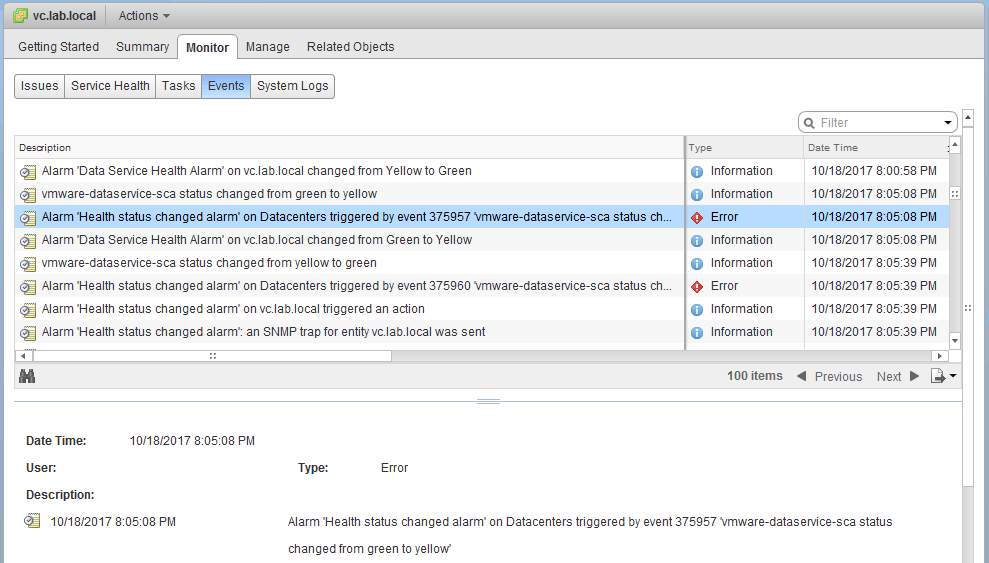
The two specific alarms were service health status alarms with the following text strings associated:
The vmware-dataservice-sca status changed from green to yellow
I’d also see this accompanied by a similar message referring to the vSphere Web Client:
The vsphere-client status changed from green to yellow
After doing some searching online, I quickly found VMware KB 2144950 on the subject. Although the cause of this seems pretty clear – insufficient memory allocation to the vsphere-client service – the workaround steps outlined in the KB are lacking context and could use some elaboration.
According to KB 2144950, some inventory sizes and plugins may have varying memory requirements for the vSphere Web Client service. Since I’m using the NSX plugin, perhaps this is contributing. My inventory size is squarely in the ‘Tiny’ deployment realm with only six hosts and a couple dozen VMs.
A Quick Note on VC 6.x Automatic Memory Scaling
In pre-6.x versions of vSphere, you could easily increase the amount of memory on the vCenter appliance, but the memory allocated to individual services would not always scale accordingly and the extra RAM would only be used by the underlying Linux OS. This usually resulted in manual tweaking to get the services to take advantage of the wasted memory.
Beginning with vSphere 6, VMware introduced automatic memory scaling. As additional memory was added to the appliance, service allocations were automatically increased as well to take advantage of it. This seemed to be intelligent as well – some services would benefit with a few megs, and other services like the inventory service would get a lot more. William Lam (@lamw) did a great writeup on this if you’d like to learn more.
Tweaking the Memory Allocation
Before I did any tweaking, I logged into the vCenter appliance to see what the current service allocations looked like. The following cloudvm-ram-size command will get this information:
vc:~ # cloudvm-ram-size -l
vmcad                =      224
vmafdd               =       20
vmware-rbd-watchdog  =      100
applmgmt             =      103
vmware-vws           =       42
vmware-vsan-health   =      100
vmware-vsm           =      160
vmware-invsvc        =     1143
vmware-stsd          =      325
vmware-vpostgres     =      545
vmware-syslog-health =       96
vmware-sts-idmd      =      321
vmware-mbcs          =      128
vmware-netdumper     =       20
vmware-perfcharts    =      300
vmware-vdcs          =      775
vsphere-client       =      783
vmware-cm            =      224
vmware-rhttpproxy    =       26
vmware-sca           =      128
vmware-vpxd          =      888
vmware-eam           =      160
vmware-vapi-endpoint =      160
vmware-vpx-workflow  =      214
OS                   =      658
vmware-sps           =      352
TOTAL(MB)            =     7995
As you can see above, there is a total of 7995 MB allocated, and the vsphere-client service is allocated 783MB.
Now you may be thinking, “If I just increase the amount of memory on the appliance and reboot, the vsphere-client service would automatically scale up. Shouldn’t that do the trick?”
And you’d be correct – the vCenter appliance will certainly allocate more memory to a number of services, but it may not be sufficient and it may allocate the majority of the extra memory to services that don’t actually need it. In essence, you’d have to add a lot of extra memory just to get a small increase in allocation to the vsphere-client service.
KB 2144950 talks about simply increasing the memory allocation to the vsphere-client service without adding more memory to the appliance. The problem with this approach is that since all memory is already allocated, the extra allocation has to come from somewhere. It’s like “robbing Peter to pay Paul”. The vsphere-client service will have extra memory available, and your alarms may clear up, but it’s likely that other key services like the VMware Inventory service will have less than it would by default in a ‘Tiny’ deployment.
Thankfully, it isn’t necessary to add a ton of extra memory to the vCenter appliance to boost vsphere-client memory allocation. Even a paltry 256MB would allow an increase of up to 33% without having to steal memory from other services.
Making the Change
In my lab, I’m not really starved for RAM on my management host, but I don’t want to waste it either. I decided to add an extra 1GB to the appliance to take it up to 9216MB total.
After booting up the appliance with the extra memory, I had a look at the memory allocation. Unfortunately, I didn’t take a screenshot but noticed that most of the services saw only a small increase in memory allocation. The vsphere-client service allocation increased less 8%. I don’t recall the exact value but I believe it was around 850MB or so. The vast majority of the extra memory was allocated to the VMware Inventory (vmware-invsvc) service. Extra memory should equate to greater scalability, so I suspect this is why this service gets the most.
Since my vCenter inventory is quite small at only six hosts, I want to direct more of that extra memory to the vsphere-client service instead of vmware-invsvc. I decided to boost the vsphere-client service about 30% from about 783MB to around 1024MB. The appliance would then be free to allocate the rest as it sees fit. That way the vsphere-client service would benefit significantly, and other services would also benefit, but to a smaller degree.
To do this, I simply needed to run the following command:
vc:~ # cloudvm-ram-size -C 1024 vsphere-client
I then needed to restart the vSphere Web Client service for the change to take effect:
vc:~ # service vsphere-client restart
Looking at the memory allocated after the change, I can now see that more of the extra 1GB was given to the vsphere-client service, and the amount allocated to the inventory service and other services was reduced accordingly. In the end, there is still more allocated across the board, but the biggest boost was given to the vsphere-client service.
vc:~ # cloudvm-ram-size -l
vmcad                =      224
vmafdd               =       21
vmware-rbd-watchdog  =      100
applmgmt             =      107
vmware-vws           =       42
vmware-vsan-health   =      100
vmware-vsm           =      160
vmware-invsvc        =     1320
vmware-stsd          =      333
vmware-vpostgres     =      596
vmware-syslog-health =       96
vmware-sts-idmd      =      323
vmware-mbcs          =      128
vmware-netdumper     =       20
vmware-perfcharts    =      319
vmware-vdcs          =      787
vsphere-client       =     1280
vmware-cm            =      225
vmware-rhttpproxy    =       27
vmware-sca           =      128
vmware-vpxd          =     1065
vmware-eam           =      160
vmware-vapi-endpoint =      160
vmware-vpx-workflow  =      214
OS                   =      677
vmware-sps           =      393
TOTAL(MB)            =     9005
Interestingly, despite setting a value of 1024MB, the allocation was actually 1280MB. I assume there is still some dynamic aspects to this despite setting a target allocation value. None the less, it’s close enough to what I was looking for.
For a summary of before/after allocation to a few key services:
vmware-invsvc: 15% increase
vmware-vpxd: 20% increase
vsphere-client: 63% increase
vmware-vpostgres: 9% increase
OS: 3% increase
Conclusion
So rather than opting for a meager 8% increase from automatic scaling, I was able to boost it by 63% by setting a manual target. I’m happy to report that all of the frequent alarms I would get are now gone, and that the vSphere Web Client feels a bit snappier. I wouldn’t go so far as to say it’s dramatically faster, but I would say it feels more consistent and doesn’t suffer from the occasional refresh lags I was experiencing before.
The only thing I’m not sure about is removing the manual allocation and reverting back to the default automatic scaling for the service. If anyone knows, please let me know!
