Welcome to the tenth installment of my NSX troubleshooting series – a milestone number for the one-year anniversary of vswitchzero.com. I wasn’t sure how many of these I’d write, but I’ve gotten lots of positive feedback so if I can keep thinking of scenarios, I’ll keep going!
What I hope to do in these posts is share some of the common issues I run across from day to day. Each scenario will be a two-part post. The first will be an outline of the symptoms and problem statement along with bits of information from the environment. The second will be the solution, including the troubleshooting and investigation I did to get there.
I’ll try to include some questions as well for educational purposes in each post.
The Scenario
As always, we’ll start with a brief problem statement:
“I’m using an ESG load balancer to send syslog traffic to a pool of two Linux servers. I can only seem to get UDP syslog traffic to arrive at the pool members. TCP based syslog traffic doesn’t work. I’m using a one-armed load balancer. If I do a packet capture, all I see is the UDP traffic but it’s not coming from the load balancer”
Using the NSX load balancer services for syslog purposes is not at all uncommon. We see this frequently with products like Splunk as well as others. Since syslog traffic can be very heavy, this is a good use case.
When it comes to troubleshooting NSX load balancer issues, triple checking the configuration is key. In speaking with the customer, this is his desired outcome:
- One-armed load balancer in VLAN 15.
- No routing done by the edge. Default gateway configuration only and a single interface for simplicity.
- Transparency is not required – the source IP can be the load balancer as the required source information is in the syslog data transmitted.
- A mix of both TCP and UDP port 514 traffic is to be load balanced.
Here is a basic, high-level topology provided by the customer:
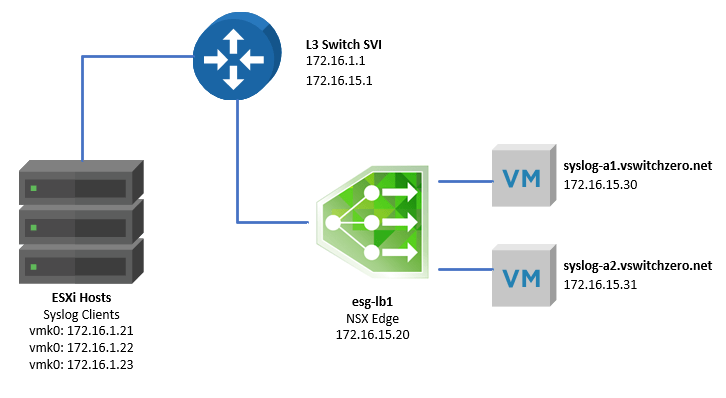
The one armed load balancer called esg-lb1 is sitting in VLAN 15. It’s default gateway is the SVI interface of the physical switch (172.16.15.1). There is only one hop between the ESXi hosts – the syslog clients – and the ESG in VLAN 15. Because this is a one-armed topology, the syslog-a1 and syslog-a2 servers are using the same switch SVI as their default gateway.
At the moment, hosts esx-a1 (172.16.1.21) and esx-a2 (172.16.1.22) are configured to point to 172.16.15.20 on TCP port 514 for syslog. Host esx-a3 (172.16.1.23) is also pointed at the load balancer, but for UDP 514 instead of TCP.
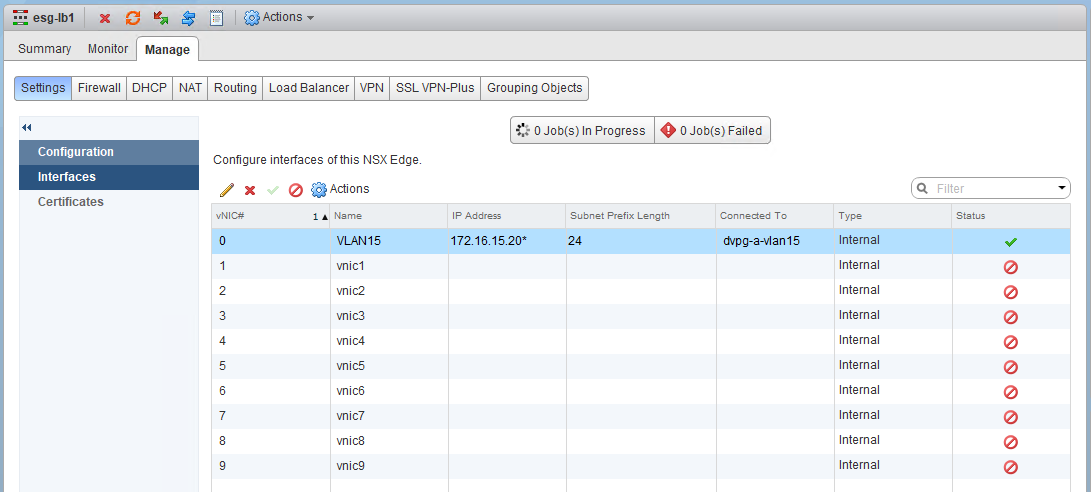
vNic0 on the ESG is the only defined interface. It’s connected to a dvPortgroup, not a logical switch.
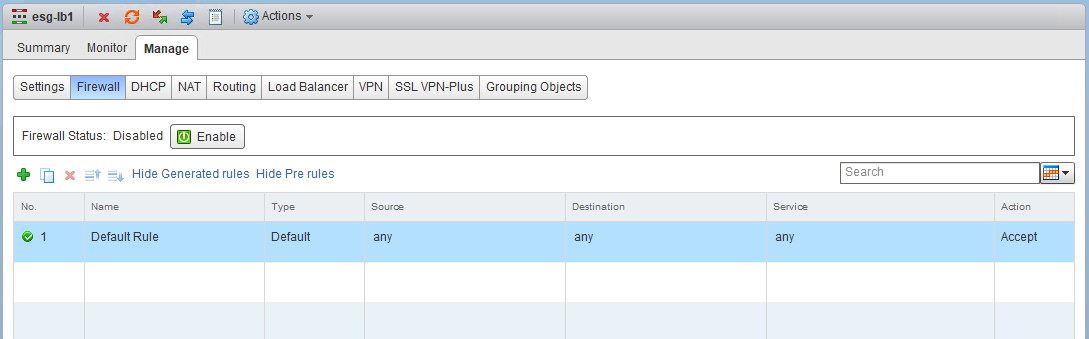
The ESG firewall is disabled and there are no custom rules defined.
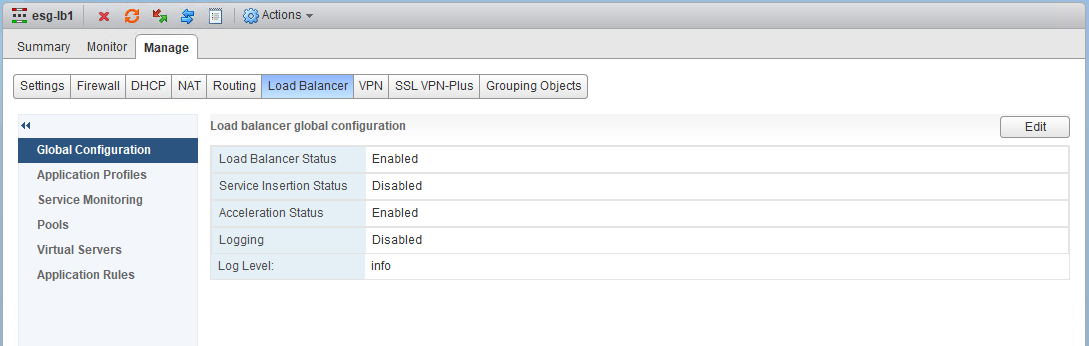
The load balancer is enabled, and acceleration is also enabled. Acceleration is required when using any UDP virtual servers, so this is expected.
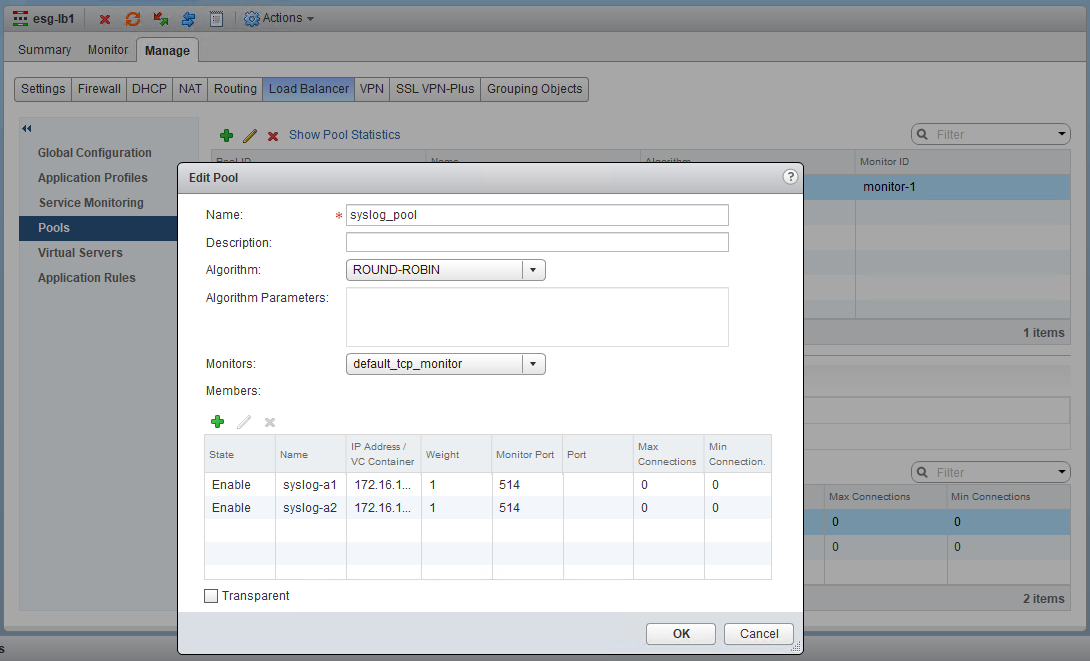
As you can see, both syslog servers are in the pool and using the default TCP monitor on port 514 for health checks.
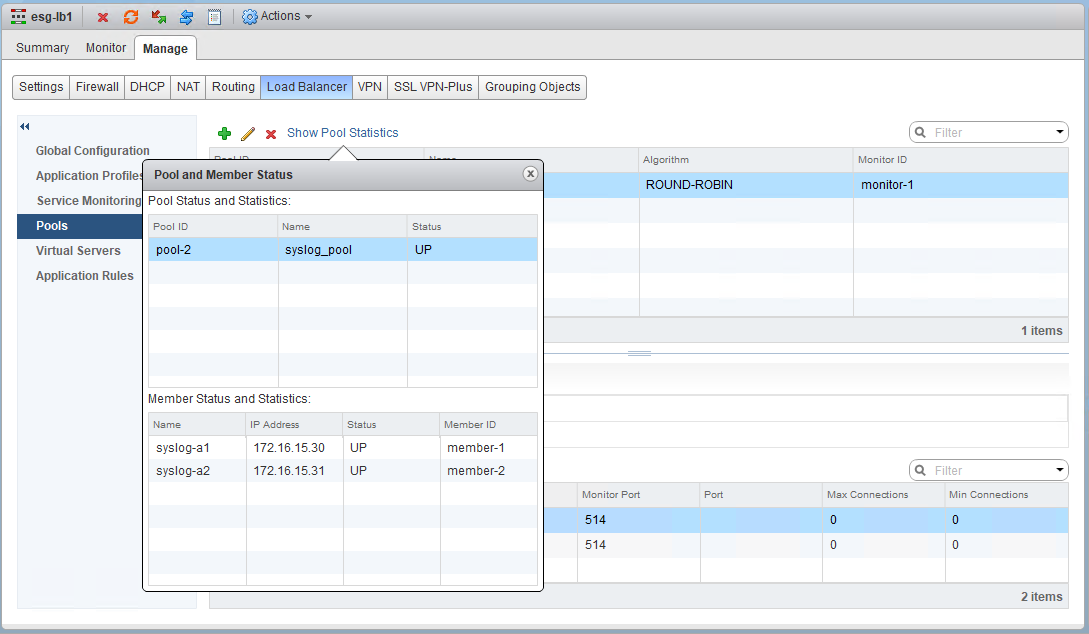
From a health check perspective, both pool members are ‘UP’ – i.e. both are responding to TCP protocol checks on port 514.
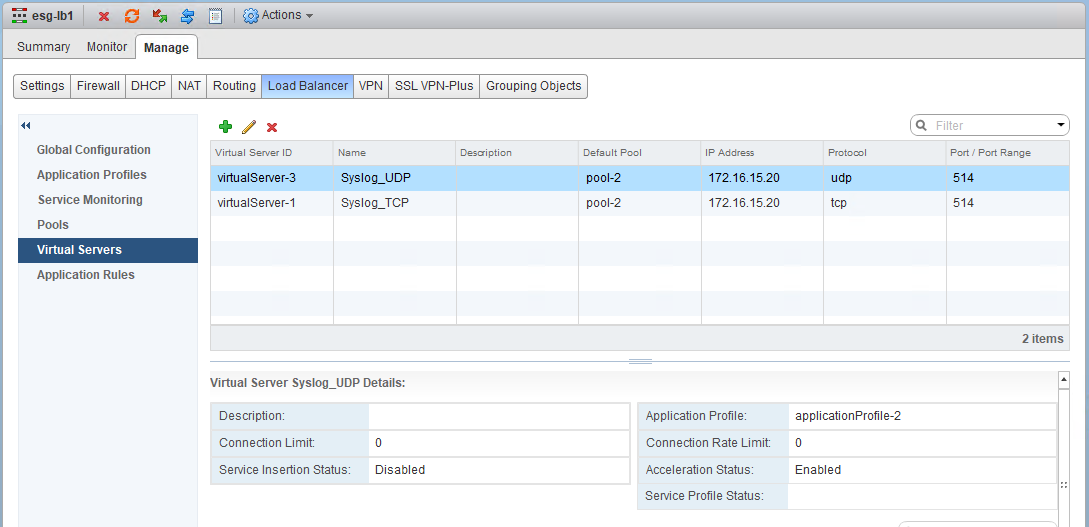
As expected, we have a virtual server defined for both TCP and UDP on port 514. Both point to the same pool.
The customer also reported that when he does a packet capture on the syslog-a2 box, he sees the UDP traffic coming from the IP of esx-a3, not from the load balancer as expected. Below is an example:
23:27:45.539331 IP esx-a3.vswitchzero.net.21498 > syslog-a1.vswitchzero.net.syslog: SYSLOG local4.debug, length: 170
23:27:45.539381 IP esx-a3.vswitchzero.net.21498 > syslog-a1.vswitchzero.net.syslog: SYSLOG local4.debug, length: 163
23:27:46.518172 IP esx-a3.vswitchzero.net.21498 > syslog-a1.vswitchzero.net.syslog: SYSLOG local4.debug, length: 165
23:27:46.518185 IP esx-a3.vswitchzero.net.21498 > syslog-a1.vswitchzero.net.syslog: SYSLOG local4.debug, length: 173
23:27:46.521540 IP esx-a3.vswitchzero.net.21498 > syslog-a1.vswitchzero.net.syslog: SYSLOG local4.debug, length: 162
23:27:46.521548 IP esx-a3.vswitchzero.net.21498 > syslog-a1.vswitchzero.net.syslog: SYSLOG local4.debug, length: 170
23:27:46.521626 IP esx-a3.vswitchzero.net.21498 > syslog-a1.vswitchzero.net.syslog: SYSLOG local4.debug, length: 170
Questions:
- What does enabling/disabling acceleration mean in the context of the NSX load balancer?
- Why are two virtual servers defined here?
- What is the difference between the ‘Monitor Port’ and the ‘Port’ defined in the pool configuration?
- This scenario uses a ‘one armed’ load balancer configuration. How does a one armed load balancer work and how does it differ from more traditional configurations?
- What is odd about the packet capture? Why shouldn’t the traffic be shown as originating from the ESXi hosts?
- What configuration is required for the load balancer to work in this mode? Could something be missing here?
What’s Next?
I’ll post the solution in the next day or two, but pay close attention to the screenshots. What stands out that may provide a hint? Take a shot at the questions listed above. You may find that if you look into them, it will lead you straight to the solution.
How would you handle this scenario? Let me know! Please feel free to leave a comment below or via Twitter (@vswitchzero).
