Virtual Extensible LAN – or VXLAN – is the key overlay technology that makes a lot of what NSX does possible. It abstracts the underlying L2/L3 network and allows logical switches to span vast networks and datacenters. To achieve this, each ESXi hypervisor has one or more VTEP vmkernel ports bound the the host’s VXLAN network stack instance.
Your VTEPs are created during VXLAN preparation – normally after preparing your hosts with the NSX VIBs. Doing this in the UI is a straight forward process, but there are some important pre-requisites that must be fulfilled before VXLAN networking will work. Most important of these are:
- Your physical networking must be configured for an end-to-end MTU of 1600 bytes. In theory it’s 1550, but VMware usually recommends a minimum of 1600.
- You must ensure L2 and L3 connectivity between all VTEPs.
- You need to prepare for IP address assignment by either configuring DHCP scopes or IP pools.
- If your replication mode is hybrid, you’ll need to ensure IGMP snooping is configured on each VLAN used by VTEPs.
- Using full Multicast mode? You’ll need IGMP snooping in addition to PIM multicast routing.
This can sometimes be easier said than done – especially if you have hosts in multiple locations with numerous hops to traverse.
Testing VXLAN VTEP communication is a key troubleshooting skill that every NSX engineer should have in their toolbox. Without healthy VTEP communication and a properly configured underlay network, all bets are off.
I know this is a pretty well covered topic, but I wanted to dive into this a little bit deeper and provide more background around why we test the way we do, and how to draw conclusions from the results.
The VXLAN Network Stack
Multiple network stacks were first introduced in vSphere 6.0 for use with vMotion and other services. There are several benefits to isolating services based on network stacks, but the most practical is a completely independent routing table. This means you can have a different default gateway for vMotion – or in this case VXLAN traffic – than you would for all other management services.
Each vmkernel port that is created on an ESXi host must belong to one and only one network stack. When your cluster is VXLAN prepared, the created kernel ports are automatically assigned to the correct ‘vxlan’ network stack.
Using the esxcfg-vmknic -l command will list all kernel ports including their assigned network stack:
[root@esx-a1:~] esxcfg-vmknic -l
Interface  Port Group/DVPort/Opaque Network        IP Family IP Address                              Netmask         Broadcast       MAC Address       MTU     TSO MSS NetStack
vmk0       7                                       IPv4      172.16.1.21                             255.255.255.0   172.16.1.255    00:25:90:0b:1e:12 1500    65535   defaultTcpipStack
vmk1       13                                      IPv4      172.16.98.21                            255.255.255.0   172.16.98.255   00:50:56:65:59:a8 9000    65535   defaultTcpipStack
vmk2       22                                      IPv4      172.16.11.21                            255.255.255.0   172.16.11.255   00:50:56:63:d9:72 1500    65535   defaultTcpipStack
vmk4       vmservice-vmknic-pg                     IPv4      169.254.1.1                             255.255.255.0   169.254.1.255   00:50:56:61:7a:23 1500    65535   defaultTcpipStack
vmk3       52                                      IPv4      172.16.76.22                            255.255.255.0   172.16.76.255   00:50:56:6b:e4:94 1600    65535   vxlan
Notice that all kernel ports belong to the ‘defaultTcpipStack’ except for vmk3, which lists vxlan. You can view the netstacks currently enabled on your host using the esxcli network ip netstack list command:
[root@esx-a1:~] esxcli network ip netstack list
defaultTcpipStack
   Key: defaultTcpipStack
   Name: defaultTcpipStack
   State: 4660

vxlan
   Key: vxlan
   Name: vxlan
   State: 4660
The important thing to remember about multiple network stacks is that you have to tell your diagnostic commands which network stack you want to run the command against. For example, to view the host’s routing table you’d use the following command:
[root@esx-a1:~] esxcfg-route -l
VMkernel Routes:
Network          Netmask          Gateway          Interface
169.254.1.0      255.255.255.0    Local Subnet     vmk4
172.16.1.0       255.255.255.0    Local Subnet     vmk0
172.16.11.0      255.255.255.0    Local Subnet     vmk2
172.16.98.0      255.255.255.0    Local Subnet     vmk1
default          0.0.0.0          172.16.1.1       vmk0
What you see above is the routing table for the defaultTcpipStack. We got this output because we didn’t tell the command which network stack to use. You’ll notice that vmk3 and its directly connected 172.16.76.0/24 network are nowhere to be found. According to this, we’d need to route via the 172.16.1.1 default gateway to get to the 172.16.76.0/24 network. And this would be correct – if we do a traceroute, you’ll see it does indeed route to the destination via vmk0:
[root@esx-a1:~] traceroute 172.16.76.23
traceroute: Warning: Multiple interfaces found; using 172.16.1.21 @ vmk0
traceroute to 172.16.76.23 (172.16.76.23), 30 hops max, 40 byte packets
 1  172.16.1.1 (172.16.1.1)  1.094 ms  0.564 ms  0.454 ms
 2  172.16.76.23 (172.16.76.23)  2.155 ms  0.364 ms  0.204 ms
Again, the traceroute command was run without specifying a network stack, so it’s using the defaultTcpipStack.
To display the routing table specifically for the vxlan network stack, we’d need to modify the command slightly with the -N parameter:
[root@esx-a1:~] esxcfg-route -l -N vxlan

VMkernel Routes:
Network          Netmask          Gateway          Interface
172.16.76.0      255.255.255.0    Local Subnet     vmk3
default          0.0.0.0          172.16.76.1      vmk3
Notice the routing table is completely different, as is the default route of 172.16.76.1. When this ESXi host does anything VXLAN related, it’ll be referring to this table, not the default one. Notice that when I do a traceroute and specify the vxlan network stack, we get a completely different result:
[root@esx-a1:~] traceroute ++netstack=vxlan 172.16.76.23
traceroute to 172.16.76.23 (172.16.76.23), 30 hops max, 40 byte packets
1         172.16.76.23 (172.16.76.23)  1.032 ms  0.357 ms  0.142 ms
We no longer use vmk0, but rather the kernel interface associated with the vxlan network stack. If this destination IP needed to route, it would use the gateway associated with the vxlan network stack as well.
Using Ping
Using ping is a great way to test end-to-end VTEP reachability, but it’s critical that the syntax is correct. In order to get a trustworthy result, we’d need to ensure the following:
- Use the ++netstack=vxlan parameter with the ping command. If we don’t, we won’t be using the same datapath that VTEP communication will be using (see the previous section).
- Because VXLAN requires an MTU greater than 1500, we want to specify an appropriate packet size. This is done with the -s parameter. For a 1600 MTU, we’d use -s 1572 and for a 9000 MTU, -s 8972. The value specified here is slightly smaller than the MTU because the -s parameter is for payload size and doesn’t include packet overhead.
- Some network devices can fragment packets larger than the MTU. We don’t want this because it fools us into thinking our MTU is configured correctly when in fact it is not. We can instruct equipment along the path to keep packets intact by specifying the ‘do not fragment’ -d flag.
- When VXLAN is configured with a teaming policy creating more than one VTEP (multi-VTEP), you’ll need to manually specify each of the VXLAN VTEPs independently. This can be done using the -I vmk# flag.
Let’s use my esx-a1 host as an example. It has a single VTEP, vmk3 with a 1600 MTU. I’ll try to communicate with esx-a3 with IP address 172.16.76.23:
[root@esx-a1:~] ping ++netstack=vxlan 172.16.76.23 -s 1572 -d
PING 172.16.76.23 (172.16.76.23): 1572 data bytes
1580 bytes from 172.16.76.23: icmp_seq=0 ttl=64 time=0.467 ms
1580 bytes from 172.16.76.23: icmp_seq=1 ttl=64 time=0.793 ms
1580 bytes from 172.16.76.23: icmp_seq=2 ttl=64 time=0.563 ms
Because the above was successful, we know that L3 communication is good, and that the end-to-end MTU of 1600 is configured correctly along the datapath.
If you’ve got multiple VTEPs, you’d need to run several ping tests. Let’s assume that we have a host with two VTEPs, and the destination also has two. We’ll assume both vmk3 and vmk4 are used for vxlan in this case. We’d need to run a total of four tests:
# ping ++netstack=vxlan 172.16.76.23 -s 1572 -d -I vmk3
# ping ++netstack=vxlan 172.16.76.24 -s 1572 -d -I vmk3
# ping ++netstack=vxlan 172.16.76.23 -s 1572 -d -I vmk4
# ping ++netstack=vxlan 172.16.76.24 -s 1572 -d -I vmk4
So not only do we need to run the test for both vmk3 and vmk4, but we need to be able to reach both destination VTEPs from each of them. As the number of VTEPs increase, the number of ping tests you’ll need to do increases exponentially. For four VTEPs, this would be sixteen tests!
You may think that these ping tests guarantee that your hosts will be able to communicate between VTEPs, but this is not entirely true. Remember – ping uses ICMP, actual VXLAN communication is UDP port 4789. If there is a physical firewall in the datapath this traffic type must be allowed. Thankfully, the UI based VXLAN tests use real VXLAN segments for testing and can provide some extra assurance.
VTEP Testing in the UI
Although I do prefer doing the ping tests described in the previous section, VMware thoughtfully included testing functionality in the UI as well. It’s a little awkward to navigate to this, but you’ll need to go to the following location:
- Go to Networking and Security in the vSphere Web Client
- Click on Logical Switches
- Double-click one of your logical switches that you’d like to test. This is the odd part – you have to double click on the logical switch as there are no buttons or right-click options that will get you to the right place.
- Next, click the ‘Monitor’ tab, and you’ll be greeted by the center pane prompting for ‘Test Parameters’.
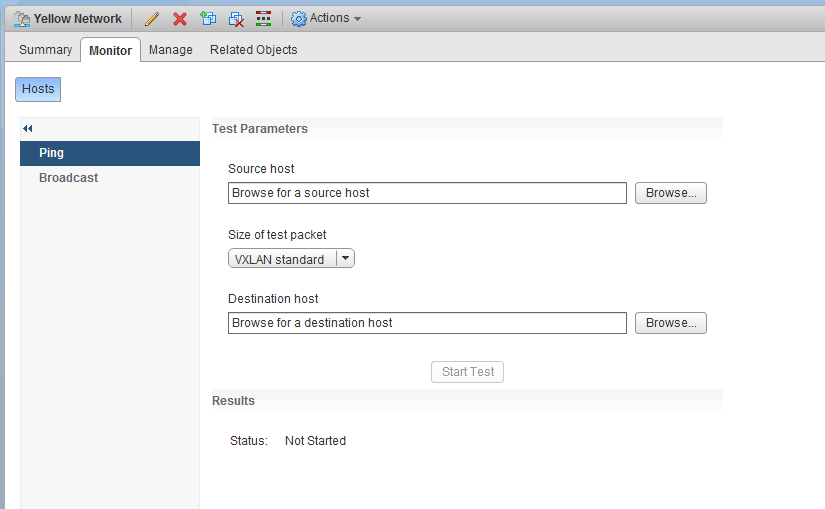
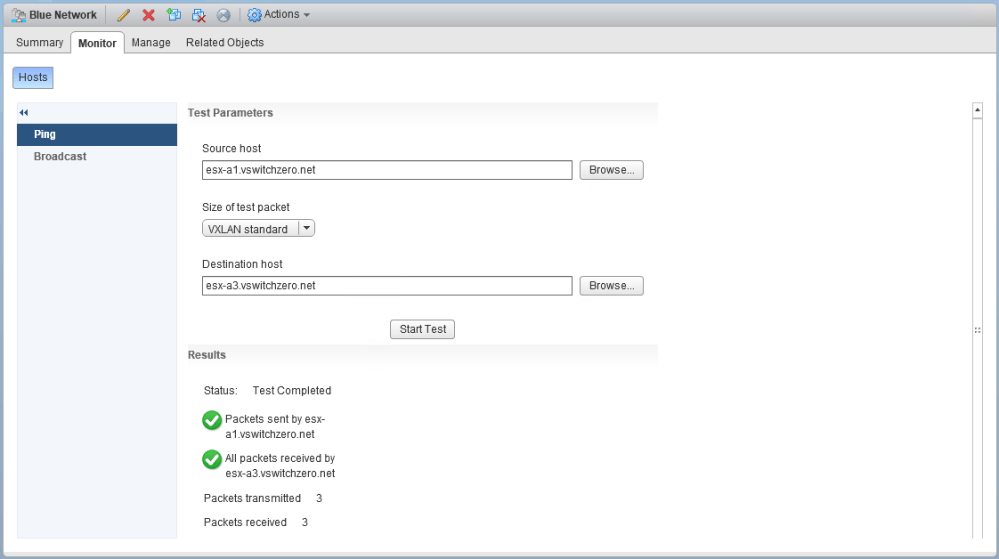
From here, you simply select your source and destination host and click ‘Start Test’.
You’ll notice that this interface allows you to select both ‘VXLAN standard’ and ‘Minimum’. As you’d expect, the standard size will be the maximum data payload allowed based on your configured MTU. You’ll always want to use this option with this tool unless the test fails. If the ‘Minimum’ size works but ‘VXLAN standard’ doesn’t, there is a very good chance your MTU isn’t correct somewhere along the datapath.
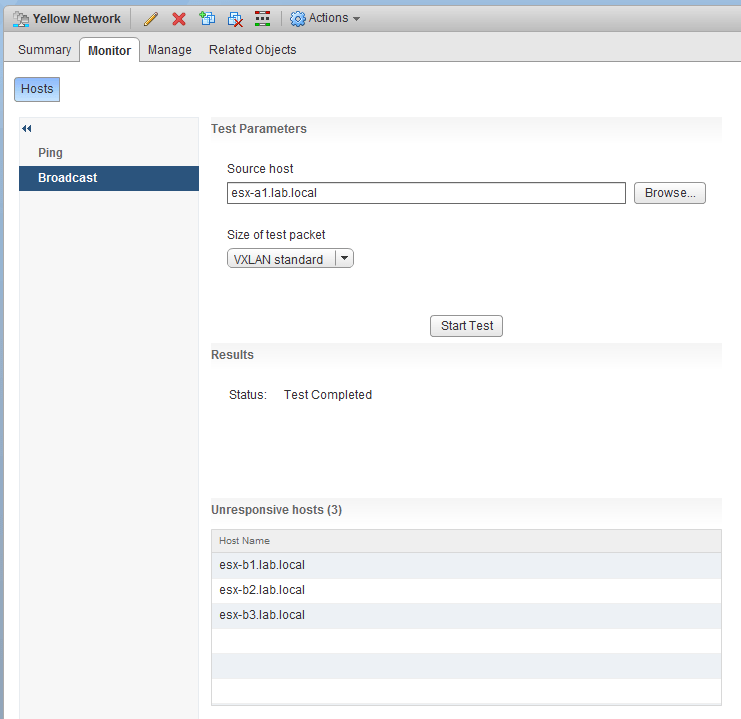
Another neat feature that can save time is the ‘Broadcast’ option, which simply runs the test against all ESXi hosts in the transport zone with access to the selected logical switch. any hosts that don’t respond will be listed similar to the following:
There are a few benefits to using this UI test – namely that you don’t need VMs on your logical switches to test, and that this utility uses actual VXLAN UDP segments for testing – not ICMP.
Conclusion
I know that was a rather lengthy post on a simple topic, but I hope it provides some additional background and context to better understand VTEP networking. Whenever you are deploying NSX, take the time to thoroughly test your VTEP to VTEP communication. So much of what NSX does relies on a healthy underlay network. If your underlay isn’t configured correctly, you can pretty much guarantee headaches and frustration.
Please feel free to leave a comment below or reach out to me on Twitter (@vswitchzero)
