ESXi is generally very efficient when it comes to basic network I/O processing. Guests are able to make good use of the physical networking resources of the hypervisor and it isn’t unreasonable to expect close to 10Gbps of throughput from a VM on modern hardware. Dealing with very network heavy guests, however, does sometimes require some tweaking.
I’ll quite often get questions from customers who observe TCP re-transmissions and other signs of packet loss when doing VM packet captures. The loss may not be significant enough to cause a real application problem, but may have some performance impact during peak times and during heavy load.
After doing some searching online, customers will quite often land on VMware KB 2039495 and KB 1010071 but there isn’t a lot of context and background to go with these directions. Today I hope to take an in-depth look at VMXNET3 RX buffer exhaustion and not only show how to increase buffers, but to also to determine if it’s even necessary.
Rx Buffering
Not unlike physical network cards and switches, virtual NICs must have buffers to temporarily store incoming network frames for processing. During periods of very heavy load, the guest may not have the cycles to handle all the incoming frames and the buffer is used to temporarily queue up these frames. If that buffer fills more quickly than it is emptied, the vNIC driver has no choice but to drop additional incoming frames. This is what is known as buffer or ring exhaustion.
A Lab Example
To demonstrate ring exhaustion in my lab, I had to get a bit creative. There weren’t any easily reproducible ways to do this with 1Gbps networking, so I looked for other ways to push my test VMs as hard as I could. To do this, I simply ensured the two test VMs were sitting on the same ESXi host, in the same portgroup. This removes all physical networking and allows the guests to communicate as quickly as possible without the constraints of physical networking components.
To run this test, I used two VMs with Debian Linux 7.4 (3.2 kernel) on them. Both are very minimal deployments with only the essentials. From a virtual hardware perspective, both have a single VMXNET3 adapter, two vCPUs and 1GB of RAM.
Although VMware Tools is installed in these guests, they are using the ‘-k’ distro bundled version of the VMXNET3 driver. The driver installed is 1.1.29.0.
root@iperf-test1:~# ethtool -i eth0
driver: vmxnet3
version: 1.1.29.0-k-NAPI
firmware-version: N/A
bus-info: 0000:03:00.0
supports-statistics: yes
supports-test: no
supports-eeprom-access: no
supports-register-dump: yes
supports-priv-flags: no
To generate large amounts of TCP traffic between the two machines, I used iperf 2.0.5 – a favorite that we use for network performance testing. The benefit of using iperf over other tools and methods is that it does not need to write or read anything from disk for the transfer – it simply sends/received TCP data to/from memory as quickly as it can.
Although I could have done a bi-directional test, I decided to use one machine as the sender and the other as the receiver. This helps to ensure one side is especially RX heavy.
root@iperf-test2:~# iperf -c 172.16.10.151 -t 300 -i 2 -P 12
------------------------------------------------------------
Client connecting to 172.16.10.151, TCP port 5001
TCP window size: 21.0 KByte (default)
------------------------------------------------------------
[ 14] local 172.16.10.150 port 45280 connected with 172.16.10.151 port 5001
[ 4] local 172.16.10.150 port 45269 connected with 172.16.10.151 port 5001
[ 5] local 172.16.10.150 port 45271 connected with 172.16.10.151 port 5001
[ 6] local 172.16.10.150 port 45273 connected with 172.16.10.151 port 5001
[ 7] local 172.16.10.150 port 45272 connected with 172.16.10.151 port 5001
[ 8] local 172.16.10.150 port 45274 connected with 172.16.10.151 port 5001
[ 3] local 172.16.10.150 port 45270 connected with 172.16.10.151 port 5001
[ 9] local 172.16.10.150 port 45275 connected with 172.16.10.151 port 5001
[ 10] local 172.16.10.150 port 45276 connected with 172.16.10.151 port 5001
[ 11] local 172.16.10.150 port 45277 connected with 172.16.10.151 port 5001
[ 12] local 172.16.10.150 port 45278 connected with 172.16.10.151 port 5001
[ 13] local 172.16.10.150 port 45279 connected with 172.16.10.151 port 5001
[ ID] Interval Transfer Bandwidth
[ 14] 0.0- 2.0 sec 918 MBytes 3.85 Gbits/sec
[ 4] 0.0- 2.0 sec 516 MBytes 2.16 Gbits/sec
[ 5] 0.0- 2.0 sec 603 MBytes 2.53 Gbits/sec
[ 6] 0.0- 2.0 sec 146 MBytes 614 Mbits/sec
[ 7] 0.0- 2.0 sec 573 MBytes 2.40 Gbits/sec
[ 8] 0.0- 2.0 sec 894 MBytes 3.75 Gbits/sec
[ 3] 0.0- 2.0 sec 596 MBytes 2.50 Gbits/sec
[ 9] 0.0- 2.0 sec 916 MBytes 3.84 Gbits/sec
[ 10] 0.0- 2.0 sec 548 MBytes 2.30 Gbits/sec
[ 11] 0.0- 2.0 sec 529 MBytes 2.22 Gbits/sec
[ 12] 0.0- 2.0 sec 930 MBytes 3.90 Gbits/sec
[ 13] 0.0- 2.0 sec 540 MBytes 2.26 Gbits/sec
[SUM] 0.0- 2.0 sec 7.53 GBytes 32.3 Gbits/sec
On the sending VM (iperf client machine) I used the -P 12 option to execute twelve parallel streams. This equates to twelve separate TCP/IP sockets and generally taxes the machine quite heavily. I also let the test run for a five minute period using the -t 300 option. As you can see above, thanks to offloading features like LRO, we’re seeing more than 32Gbps of throughput while on the same host and portgroup.
Now, although this appears to be excellent performance, it doesn’t mean there wasn’t packet loss experienced during the transfer. Packet loss also equates to TCP re-transmissions, window size adjustment and possibly performance impact. Depending on your application and the severity of the loss, you may not notice any problems, but I can pretty much guarantee that a packet capture would contain TCP duplicate ACKs and re-transmissions.
Let’s have a look at the TCP socket statistics from the sender’s perspective. Was the sender receiving duplicate ACKs and as a result re-transmitted?
root@iperf-test2:~# netstat -s |grep -i retransmit
 86715 segments retransmited
 TCPLostRetransmit: 106
 68040 fast retransmits
 122 forward retransmits
 18444 retransmits in slow start
 4 SACK retransmits failed
root@iperf-test2:~# netstat -s |grep -i loss
 645 times recovered from packet loss by selective acknowledgements
 2710 TCP data loss events
Indeed it was. There were over 86K re-transmitted segments and 2710 data loss events recorded by the guest’s TCP/IP stack. So now that we know there was application impact to some degree, let’s have a look at the other VM – the receiving side. We can use the ethtool command to view VMXNET3 driver statistics from within the guest:
root@iperf-test1:~# ethtool -S eth0 |grep -i drop
 drv dropped tx total: 0
 drv dropped tx total: 0
 drv dropped rx total: 2305
 drv dropped rx total: 979
Above we can see that there were over 3000 drops due to errors, but we’re more interested in buffering statistics. Searching for the ‘OOB’ string, we can see how many were dropped:
root@iperf-test1:~# ethtool -S eth0 |grep OOB
 pkts rx OOB: 7129
 pkts rx OOB: 3241
There are two outputs listed above because there are two RX queues in Linux – one for each vCPU on the VM. We’ll look more closely at this in the next section. Clearly, we dropped many frames due to buffering. Over 10,000 frames were dropped.
Checking Buffer Statistics from ESXi
Most Linux distros provide some good driver statistic information, but that may not always be the case. Thankfully, you can also check statistics from ESXi.
To begin, we’ll need to find both the internal port number and name of the connected vSwitch. To find this, the net-stats -l command is very useful:
[root@esx0:~] net-stats -l
PortNum Type SubType SwitchName MACAddress ClientName
<snip>
33554464 5 9 vSwitch0 00:50:56:a6:55:f4 iperf-test1
33554465 5 9 vSwitch0 00:50:56:a6:44:72 iperf-test2
Since iperf-test1 is the receiving iperf VM, I’ve made a note of the port number, which is 33554464 and the name of the vSwitch, which is vSwitch0. If your VM happens to be on a distributed switch, you’ll have an internal vSwitch name such as ‘DvsPortset-0’ and not the normal friendly label it’s given during setup.
Note: In the next few paragraphs, we’ll be using an internal debugging shell called ‘vsish’. This is an unsupported tool and should be used with caution. It’s safer to use single vsish -e commands to get information rather than trying to navigate around in the vsish shell.
To begin, we can get some generic vSwitch port statistics to see if any drops occurred. You’ll simply need to modify the below command to replace vSwitch0 with the name of your vSwitch and 33554464 with the port number you found earlier with net-stats -l.
[root@esx0:~] vsish -e get /net/portsets/vSwitch0/ports/33554464/clientStats
port client stats {
 pktsTxOK:26292806
 bytesTxOK:1736589508
 droppedTx:0
 pktsTsoTxOK:0
 bytesTsoTxOK:0
 droppedTsoTx:0
 pktsSwTsoTx:0
 droppedSwTsoTx:0
 pktsZerocopyTxOK:1460809
 droppedTxExceedMTU:0
 pktsRxOK:54807350
 bytesRxOK:1806670750824
 droppedRx:10312
 pktsSwTsoRx:26346080
 droppedSwTsoRx:0
 actions:0
 uplinkRxPkts:3401
 clonedRxPkts:0
 pksBilled:0
 droppedRxDueToPageAbsent:0
 droppedTxDueToPageAbsent:0
}
As you can see above, the droppedRx count is over 10K – about what we observed in the Linux guest. This tells us that frames were dropped, but not why.
Next, we’ll have a look at some statistics reported by the VMXNET3 adapter:
[root@esx0:~] vsish -e get /net/portsets/vSwitch0/ports/33554464/vmxnet3/rxSummary
stats of a vmxnet3 vNIC rx queue {
 LRO pkts rx ok:50314577
 LRO bytes rx ok:1670451542658
 pkts rx ok:50714621
 bytes rx ok:1670920359206
 unicast pkts rx ok:50714426
 unicast bytes rx ok:1670920332742
 multicast pkts rx ok:0
 multicast bytes rx ok:0
 broadcast pkts rx ok:195
 broadcast bytes rx ok:26464
 running out of buffers:10370
 pkts receive error:0
 # of times the 1st ring is full:7086
 # of times the 2nd ring is full:3284
 fail to map a rx buffer:0
 request to page in a buffer:0
 # of times rx queue is stopped:0
 failed when copying into the guest buffer:0
 # of pkts dropped due to large hdrs:0
 # of pkts dropped due to max number of SG limits:0
}
And again, we see some more specific statistics that help us to understand why frames were dropped. Both the first and second rings were exhausted thousands of times.
Determining the Current Buffer Settings
The default does vary from OS to OS and can also vary depending on the VMXNET3 driver version being utilized. I believe that some versions of the Windows VMXNET3 driver also allow for dynamic sizing of the RX buffer based on load.
The ethtool command is useful for determining the current ring sizes in most Linux distros:
root@iperf-test1:~# ethtool -g eth0
Ring parameters for eth0:
Pre-set maximums:
RX: 4096
RX Mini: 0
RX Jumbo: 0
TX: 4096
Current hardware settings:
RX: 512
RX Mini: 0
RX Jumbo: 0
TX: 1024
On the receiving node, we can see that the maximum possible value is 4096, but the current is 512. It’s important to note too that these settings are per RX queue. On this machine, there are actually two RX queues – one per vCPU – so that’s 256K per queue.
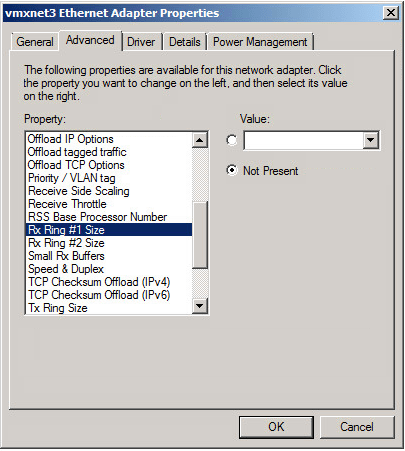
In Windows, you can see the RX Ring and buffering settings in the network adapter properties window. Unfortunately, by default the value is just ‘Not Present’ indicating that it’s using the default of the driver.
Once again, you can see the current RX queue buffer size from ESXi and this value is generally more trustworthy.
First, we can display the number of RX queues being used by the guest by running the following command:
[root@esx0:~] vsish -e ls /net/portsets/vSwitch0/ports/33554464/vmxnet3/rxqueues/
0/
1/
Above, we can see that this Linux VM has two queues – zero and one. Each will have it’s own RX queue ring that can be viewed independently like this:
[root@esx0:~] vsish -e get /net/portsets/vSwitch0/ports/33554464/vmxnet3/rxqueues/0/status
status of a vmxnet3 vNIC rx queue {
 intr index:0
 stopped:0
 error code:0
 ring #1 size:256
 ring #2 size:256
}
My Windows 2008 R2 test box has only one RX queue despite having more than one vCPU. This is because Windows implements ‘multiqueue’ differently than Linux and it’s not used by default – more on this later. Despite this, we can see that the first ring is actually twice the size as the Linux VM by default:
[root@esx0:~] vsish -e get /net/portsets/vSwitch0/ports/33554466/vmxnet3/rxqueues/0/status
status of a vmxnet3 vNIC rx queue {
 intr index:0
 stopped:0
 error code:0
 ring #1 size:512
 ring #2 size:32
}
Increasing the RX Buffer Size in Linux
Now that we’ve determined that this guest could indeed benefit from a larger queue, let’s increase it to the maximum value of 4096.
Warning: Modifying NIC driver settings may cause a brief traffic disruption. If this is a production environment, be sure to do this in a scheduled outage/change window.
In Linux, there are more than one ways to accomplish this but the easiest is to use ethtool:
root@iperf-test1:~# ethtool -G eth0 rx 4096
root@iperf-test1:~# ethtool -g eth0
Ring parameters for eth0:
Pre-set maximums:
RX: 4096
RX Mini: 0
RX Jumbo: 0
TX: 4096
Current hardware settings:
RX: 8192
RX Mini: 0
RX Jumbo: 0
TX: 2048
After setting it to 4096, we can see that the current hardware setting is actually 8192 (two RX queues of 4096K each).
Note: This ethtool setting will be lost as soon as the VM reboots. You’ll need to add this command to /etc/rc.local or some other startup script to ensure it persists across reboots.
From ESXi, we can also confirm that the setting took effect as we did previously:
[root@esx0:~] vsish -e get /net/portsets/vSwitch0/ports/33554464/vmxnet3/rxqueues/0/status
status of a vmxnet3 vNIC rx queue {
 intr index:0
 stopped:0
 error code:0
 ring #1 size:4096
 ring #2 size:256
}
Now we can see that queue 0 is set to 4096 as we wanted to see.
Increasing the RX Buffer Size in Windows
Making this change in Windows is a little different. VMware KB 2039495 outlines the process, but I’ll walk through it below.
Warning: Modifying NIC driver settings may cause a brief traffic disruption. If this is a production environment, be sure to do this in a scheduled outage/change window.
In theory, you can simply increase the RX Ring #1 size, but it’s also possible to boost the Small Rx Buffers that are used for other purposes.


From the network adapter properties page, I have increased Rx Ring #1 to 4096 and Small Rx Buffers to 8192.
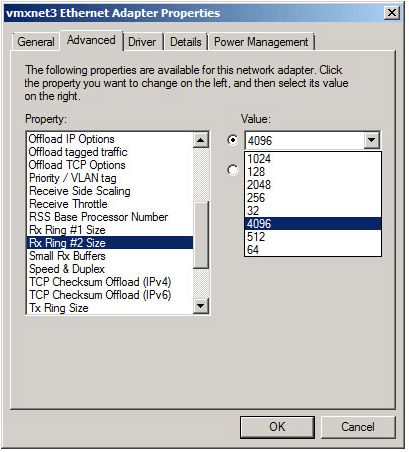
If you plan to use jumbo 9K frames in the guest, Windows can also benefit from a larger Rx Ring #2. It can be increased to 4096K, which I did also. The Large Rx Buffer value should also be maxed out if Rx Ring #2 is increased.
Once I did this, you can see that the values have taken effect from ESXi’s perspective:
[root@esx0:~] vsish -e get /net/portsets/vSwitch0/ports/33554466/vmxnet3/rxqueues/0/status
status of a vmxnet3 vNIC rx queue {
 intr index:0
 stopped:0
 error code:0
 ring #1 size:4096
 ring #2 size:4096
}
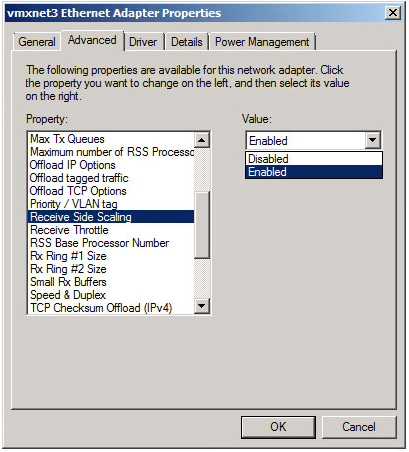
Enabling Multi-Queue Receive Side Scaling in Windows
As mentioned earlier, you’ll only have one RX queue by default with the VMXNET3 adapter in Windows. To take advantage of multiple queues, you’ll need to enable Receive Side Scaling. Again, this change will likely cause a momentary network ‘blip’ and impact existing TCP sessions. If this is a production VM, be sure to do this during a maintenance window.
This is done in the same advanced properties area:
Note: There have been some issues reported over the years with VMXNET3 and RSS in Windows. I didn’t experience any issues with modern builds of ESXi and the VMXNET3 driver, but this should be enabled with caution and thorough performance testing should be conducted to ensure it’s having a positive benefit.
Once this was done, I could see two queues with the maximum ring sizes:
[root@esx0:~] vsish -e ls /net/portsets/vSwitch0/ports/33554466/vmxnet3/rxqueues/
0/
1/
[root@esx0:~] vsish -e get /net/portsets/vSwitch0/ports/33554466/vmxnet3/rxqueues/0/status
status of a vmxnet3 vNIC rx queue {
 intr index:0
 stopped:0
 error code:0
 ring #1 size:4096
 ring #2 size:4096
}
Measuring Improvements
Now that I’ve maxed out the RX buffers, I’ll be rebooting the guests to clear the counters and then repeating the test I ran earlier.
Although my testing methodology is far from precise, I did notice a slight performance increase in the test. Previously, I got about 32.5Gbps, now it’s consistently over 33Gbps. I suspect this improvement is due to a healthier TCP stream with fewer re-transmissions.
Let’s have a look:
root@iperf-test2:~# netstat -s |grep -i retransmit
 48 segments retransmited
 47 fast retransmits
That’s a huge improvement. We went from over 86,000 re-transmissions down to only a small handful. Next, let’s look at the VMXNET3 buffering:
root@iperf-test1:~# ethtool -S eth0 |grep -i OOB
 pkts rx OOB: 505
 pkts rx OOB: 1151
Although it’s not surprising that there was still some small amount of buffer exhaustion, these numbers are only about 10% of what they were previously. Let’s have a look from ESXi’s perspective:
[root@esx0:~] vsish -e get /net/portsets/vSwitch0/ports/33554467/vmxnet3/rxSummary
stats of a vmxnet3 vNIC rx queue {
 LRO pkts rx ok:37113984
 LRO bytes rx ok:1242784172888
 pkts rx ok:37235828
 bytes rx ok:1242914664554
 unicast pkts rx ok:37235740
 unicast bytes rx ok:1242914656142
 multicast pkts rx ok:0
 multicast bytes rx ok:0
 broadcast pkts rx ok:88
 broadcast bytes rx ok:8412
 running out of buffers:1656
 pkts receive error:0
 # of times the 1st ring is full:0
 # of times the 2nd ring is full:1656
 fail to map a rx buffer:0
 request to page in a buffer:0
 # of times rx queue is stopped:0
 failed when copying into the guest buffer:0
 # of pkts dropped due to large hdrs:0
 # of pkts dropped due to max number of SG limits:0
}
As you can see above, all of the loss is now due to the second ring, which we did not increase. I hope to have another look at the second ring in a future post. Normally the second ring is used for jumbo frame traffic, but I’m not clear why my guests are using it as my MTU is set to 1500. The first ring can clearly handle the deluge of packets now and didn’t exhaust once during the test.
Memory Overhead Impact
VMware’s KB 2039495 mentions increased overhead with larger receive buffers. This isn’t surprising as the guest OS needs to pre-allocate memory to use for this purpose.
Let’s have a look at what kind of increase happened on my Linux VM. To do this, I did a fresh reboot of the VM with the default RX ring, waited five minutes for things to settle and recorded the memory utilization. I then repeated this with the maxed out RX buffer.
After five minutes with the default ring:
root@iperf-test1:~# free
             total       used       free     shared    buffers     cached
Mem:       1034088      74780     959308          0       9420      35352
-/+ buffers/cache:      30008    1004080
Swap:       265212          0     265212
And again after increasing the RX ring to 4096K:
root@iperf-test1:~# free
             total       used       free     shared    buffers     cached
Mem:       1034088      93052     941036          0       9444      35352
-/+ buffers/cache:      48256     985832
Swap:       265212          0     265212
Although ~18MB may not seem like a lot of overhead, that could certainly add up over hundreds or thousands of VMs. Obviously ESXi’s memory sharing and conservation techniques will help to reduce this burden, but the key point to remember is that this extra buffering is not free from a resource perspective.
A good rule of thumb I like to tell customers is that increasing RX buffers is a great idea – just as long as a VM will actually benefit from it. The default values are probably sufficient for the vast majority of VM workloads, but if you have a VM exhibiting buffer exhaustion, there is no reason not to boost it up. I’d also go so far as to say that if you have a particular VM that you know will be traffic heavy – perhaps a new SQL box, or file server – proactively boost the buffers to the maximum possible.
Frequently Asked Questions
Q: Why are VMs more susceptible to buffer exhaustion and I don’t see these types of issues with physical servers?
A: This generally comes down to compute resources. If a VM – or physical server for that matter – can quickly process incoming frames, it’s unlikely that the buffer will get to a point where it’s full. When you have dozens or hundreds of VMs on a host all competing for compute resources, the guest may not be able to act on incoming frames quickly enough and the buffer can fill. A guest’s processing abilities may vary greatly from one moment to the next as well, which increase the risk of exhaustion.
Q: Shouldn’t TCP window scaling prevent packet loss?
A: That is mostly correct – TCP will scale the flow of segments based on network conditions, but because the loss of TCP segments is the trigger for scaling back, it’s quite likely that the buffer had to be exhausted at least once already before TCP starts reducing window size. Because a VM’s processing capability can vary due to the shared nature of resources on the hypervisor, what was fine from a TCP perspective one moment may be too heavy in the next.
Q: Does having a larger receive buffer have any disadvantages?
A: This will depend on the type of applications you are using in the guest. Having a larger buffer means that more frames can queue up. Rather than dropping frames, some frames may still make it to the guest but latency may be slightly increased. In some real-time applications like voice or video, this may not be desirable and packet loss is preferred. That said, most transaction based workloads like DB, email and file services would benefit from a larger buffer.
Q: What about increased overhead?
A: As mentioned, there is a small amount of memory overhead that the guest will use for the increased buffering. This is generally insignificant unless it’s increased across the entire environment. I generally recommend only increasing the RX buffers on VMs that will actually benefit from it.
Q: Can’t the physical NICs on the ESXi host contribute to packet loss as well?
A: They certainly can. Physical NICs on the ESXi hypervisor also have RX queues. These will vary from vendor to vendor and are sometimes configurable in the NIC driver parameters. Most physical NIC drivers are tuned appropriately for heavy traffic bursts and it isn’t usual to experience any amount of significant loss due to NIC buffers on modern hardware.
Q: Why does my Windows VM have only one RX queue?
A: The Windows VMXNET3 driver has RSS (Receive Side Scaling) disabled by default. Most modern Linux kernels will enable multiqueue support out of the box, but in Windows this will need to be turned on. Be sure to test thoroughly that RSS works correctly and that you see performance benefit.
Q: Is there any impact to existing flows when modifying RX buffers?
A: It’s always best to assume that there will be a traffic impact when modifying any driver settings like RX ring sizes. I can confirm that Windows disables/enables the adapter briefly when changing advanced VMXNET3 settings. The outage may be brief, but you’ll want to proceed with caution in a production environment.
Q: What if I’m using an E1000 adapter or something other than VMXNET3?
A: E1000 and other adapter types will often allow the tweaking of buffers as described in VMware KB 1010071. VMXNET3 has the largest configurable RX buffer sizes available of all the adapters and many other benefits. Unless there is a very specific reason for using an E1000 or other type of adapter, you should really consider moving to VMXNET3.
Conclusion
And there you have it – an often misunderstood setting that can help to mitigate packet loss and improve performance. Please feel free to leave any questions or comments below.

Thanks this helped my client. The speed over the VPN was only going 900k. We were messing with the Firewall settings but eventually looked at this. It increased to 3Mb after changing the buffer sizes
Mike,
Have you ever seen this:
fail to map a rx buffer:16496
The buffers on the guest are set to their max, but I have never seen this before.
Thanks!
Can’t say I’ve ever run into that issue before, but if I had to make an educated guess, I’d say the VM may be severely resource constrained at times or that there could be a VMXNET3 driver or netqueue/RSS problem. Is this a Linux or Windows guest?
It’s a linux VM, I agree with you that it is probably resource constraints. It’s a Linux Ubuntu 18.04 VM. Found something interesting though, in Ubuntu 16.04 if I set ‘ethtool -G ens160 rx-mini 2048’ I have no issues at all. If I do the same with 18.04, I get messages during boot that the rx ring’s have been disabled. Could explain why I was having issues after even setting the buffers on my 18.04 VM’s. This us using the VMXNET3 NIC on esxi6.5u2.
Thanks!
Hi Mike,
I have some questions, we already tried above ring size configuration in our guest operating systems which are win10 and Win7 machines but unfortunately performance test has same result of packet loss.
What are the other customization settings which we try to perform in ESXi or vm’s prospective to overcome RxDropped packet when system is in peak load ?
Thanks in advance!
Regards
Shams
Hi Shams – how much packet loss are we talking about? Small amounts are certainly not unusual for busy VMs. If the VMs aren’t reporting RX Ring exhaustion in vsish, the issue could be CPU load on the hypervisor, or an offloading feature that’s not working correctly. Be sure to check the %RDY time for the VM in question in esxtop. If the VM can’t get ample scheduling time, performance will suffer. Also, where are you seeing the packet loss? from the in-guest statistics? or somewhere in the hypervisor?
Hi Mike,
Thanks for your prompt reply!
Packet loss is 29.3 k which is droppedRx:29326
But Vm’s are not reporting RX Ring exhasution in vsish and CPU load is normal, value is as follows :
running out of buffers:0
And our ring size set as follows:
1st ring size:4096
2nd ring size:4096
%RDY time for the VM in esxtop:
ID GID NAME NWLD %USED %RUN %SYS %WAIT %VMWAIT %RDY %IDLE %OVRLP %CSTP %MLMTD %SWPWT
46786 46786 vm01 14 37.48 40.20 0.08 1397.17 0.01 2.83 373.70 0.38 0.00 0.00 0.00
1 1 system 445 18.40 4360.16 0.00 40822.80 – 610.52 0.00 19.18 0.00 0.00 0.00
We are seeing the packet loss from the ESXi host prospective and above results are esxtop but not in-guest statistics.
/stats
/rxSummary
Thanks
You may want to check the TCP/IP stats in the guest to see if it’s missing segments and recording retransmissions. The vswitch port RX drop counter can increment for some normal situations that don’t necessarily indicate a problem as well.
Hey Mike – we saw something similar in our environment but it was actually due to ESXi buffer overrun. We run Cisco UCS split up as follows: 2 vNics for mgmt (1500MTU), 2 for storage (9000MTU), 2 for VM traffic (9000MTU) 2 for vMotion (1500MTU), and 1 for PXE. We were seeing huge amounts of rx_no_buf errors on our VM Traffic NICs. Over 2000 a day. Increasing the rx and tx ring sizes to 4096 (we have 80gb backplane so I wasn’t worried about latency) solved our issues. I used vSish cat /net/pNics/vmnic6/stats and cat /net/pNics/vmnic7/stats (6/7 being VM traffic). Increasing buffer and turning on RSS solved our issue. Default UCS settings are 256/512 and no RSS for VMware adapters. Just tossing some additional experience out there in case anyone google-foos their way to an answer.
Thanks for the info, Matt! Yep – the pNics can sometimes need buffer tuning similar to VMXNET3 virtual adapters. The symptoms from the perspective of the guests are pretty much the same – packet loss and retransmissions. Thanks for sharing.
How did you identify the UCS overrun. At what level and how did you diagnose the issue.
It’s exactly what I said in the post. You run vsish against the physical nics (hence the pnic in the path)
Hi Ste – You can use the vsish path that Matt mentions above. The Cisco UCS enic adapters should provide a driver based counter called ‘rxnobuffs’ that increments when pNIC buffer exhaustion occurs:
vsish -e get /net/pNics/vmnicX/stats
You can get more general stats using the command ‘esxcli network nic stats get -n vmnicX’ as well.
We are seeing 1000’s of Ring buffer counters on our Skype for business servers ( virtual servers ) loads of dropped Rx packets. Exactly as described in the blog. RSS is enabled in windows but disabled on the VMXNET3, only see que 0, however the supporting company don’t believe it should be an issue, we getting weird issues with dropped calls and conference issues. Finally convinced my employer to make the changes tomorrow and enable RSS at the NIC and increase the RX ring and small RX buffer.
what does the vmxnet 3 option “receive throttle” mean ?
The jumbo frames your were seeing should be a result of the LRO (large receive offload) capability in the vmxnet3 driver. See the output of `ethtool -k eth0 | grep large-receive-offload`. The MTU doesn’t apply in those cases because the driver assembled the frame itself before handing it to the network layer.
Good point! That definitely makes sense.
Mike -This is an excellent article that it still quite valuable today. Did you ever get around to taking another look at the second ring values “# of times the 2nd ring is full:1656” based on your assumption that Ring#2 was only used for jumbo frames traffic – of which you had none? I have a similar situation where the second ring is filling but we do not have jumbo frames enabled anywhere.
Another option to tune is this rxBurstQueueLength:
“So it seems that ESXi 6.5 contains undocumented networking feature “Burst Queue”. If burst queuing is enabled it allows vNic RX Ring to overflow to this burst queue to avoid packet drops. ethernetX.rxBurstQueueLength sets burst queue size in actual bytes”