Welcome to the second half of ‘NSX Troubleshooting Scenario 1’ . For detail on the problem and some initial scoping, please see the first part of the scenario that I posted a few days ago. In this half, I’ll walk through some of the troubleshooting I did to find the underlying cause of this problem as well as the solution.
Where to Start?
The scoping done in the previous post gives us a lot of useful information, but it’s not always clear where to start. In my experience, it’s helpful to make educated ‘assertions’ based on what I think the issue is – or more often what I think the issue is not.
I’ll begin by translating the scoping observations into statements:
- It’s clear that basic L2/L3 connectivity is working to some degree. This isn’t a guarantee that there aren’t other problems, but it looks okay at a glance.
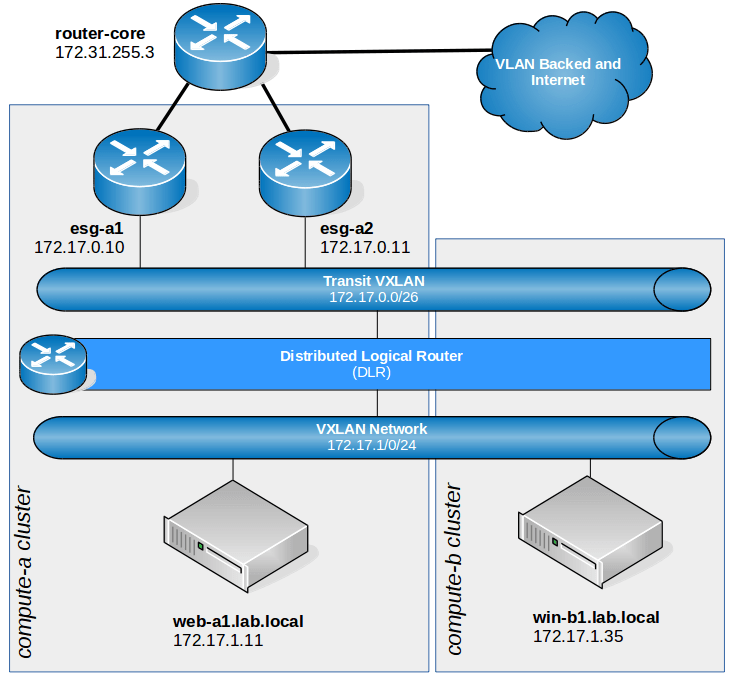
- We know that win-b1 and web-a1 are both on the same VXLAN logical switch. We also know they are in the same subnet, so that eliminates a lot of the routing as a potential problem. The DLR and ESGs should not really be in the picture here at all.
- The DFW is enabled, but looks to be configured with the default ‘allow’ rules only. It’s unlikely that this is a DFW problem, but we may need to prove this because the symptoms seem to be specific to HTTP.
- We also know that VMs in the compute-b cluster are having the same types of symptoms accessing internet based web sites. We know that the infrastructure needed to get to the internet – ESGs, physical routers etc– are all accessed via the compute-a cluster.
- It was also mentioned by the customer that the compute-b cluster was newly added. This may seem like an insignificant detail, but really increases the likelihood of a configuration or preparation problem.
Based on the testing done so far, the issue appears to be impacting a TCP service – port 80 HTTP. ICMP doesn’t seem impacted. We don’t know if other protocols are seeing similar issues.
Before we start health checking various NSX components, let’s do a bit more scoping to see if we can’t narrow this problem down even further. Right off the bat, the two questions I want answered are:
- Are we really talking to the device we expect from a L2 perspective?
- Is the problem really limited to the HTTP protocol?
Narrowing Down
To begin, I used a jump box located in a northbound VLAN network (172.16.10.0/24). One of the first problems immediately evident was that I could not RDP to the win-b1 virtual machine. It would consistently fail with an ‘Internal Error’ message. I had to open a direct console window to the VM for troubleshooting. This is another important point to note!
From the direct console, I’ll start by pinging web-a1 from win-b1 and then checking the ARP cache:
C:\Users\Administrator>ping web-a1.lab.local

Pinging web-a1.lab.local [172.17.1.11] with 32 bytes of data:
Reply from 172.17.1.11: bytes=32 time=4ms TTL=64
Reply from 172.17.1.11: bytes=32 time=1ms TTL=64
Reply from 172.17.1.11: bytes=32 time=1ms TTL=64
Reply from 172.17.1.11: bytes=32 time=1ms TTL=64

Ping statistics for 172.17.1.11:
 Packets: Sent = 4, Received = 4, Lost = 0 (0% loss),
Approximate round trip times in milli-seconds:
 Minimum = 1ms, Maximum = 4ms, Average = 1ms

C:\Users\Administrator>arp -a

Interface: 172.17.1.35 --- 0xa
 Internet Address Physical Address Type
 172.17.1.1 02-50-56-56-44-52 dynamic
 172.17.1.11 00-50-56-a6-8c-9f dynamic
 172.17.1.255 ff-ff-ff-ff-ff-ff static
 224.0.0.22 01-00-5e-00-00-16 static
 224.0.0.252 01-00-5e-00-00-fc static
I was able to confirm that 00:50:56:a6:8c:9f is indeed the MAC address for web-a1.
Next, let’s determine if TCP port 80 has been blocked by a software firewall or some other problem. I’m going to use the Windows Telnet tool to establish a basic TCP connection to port 80:
C:\Users\Administrator\telnet web-a1.lab.local 80
HTTP/1.1 400 Bad Request
Date: Mon, 04 Dec 2017 01:16:19 GMT
Server: Apache/2.2.22 (Debian)
Vary: Accept-Encoding
Content-Length: 308
Connection: close
Content-Type: text/html; charset=iso-8859-1

<!DOCTYPE HTML PUBLIC "-//IETF//DTD HTML 2.0//EN">
 <html><head>
 <title>400 Bad Request</title>
As you can see, we get an HTTP response. Even though it responded with a ‘Bad Request’, this is normal and expected. I was able to successfully open a TCP socket connection with web-a1. A quick check with netstat also supports this.
C:\Users\Administrator>netstat -a

Active Connections

Proto Local Address Foreign Address State
<snip>
 TCP 172.17.1.35:51693 web-a1:http ESTABLISHED
This simple test makes it clear that there are no L4 firewalls – DFW, software based or otherwise – blocking HTTP. We know that win-b1 can indeed establish a TCP port 80 connection with web-a1. The problem must be elsewhere.
For good measure, I repeated the same check using TCP 3389 for RDP from the jump box. I was able to successfully establish a connection.
Now that we’ve scoped things down even further – let’s recap what we know works and what doesn’t.
- I can’t load a web page on web-a1 from win-b1.
- I can’t RDP to web-b1 from a northbound jump box.
- I can ping from win-b1 to web-a1, and I can establish a basic TCP port 80 connection using Telnet.
- I can ping from a northbound location to win-b1 and I can connect to port 3389 (RDP) using Telnet.
The key point I need to note here is that there is a big difference between being able to ping or Telnet and actually using the application layer protocol. Perhaps the issue is load related. Could we be dealing with packet loss or some other issue?
Let’s logically map out the flow of traffic for these two non-working scenarios.
Problem 1:
The VXLAN underlay network outlined in the first post is fairly straight forward. The VXLAN VTEP traffic would flow in this general path:

The win-b1 VM sitting on VXLAN 5001 (Blue Network) on host esx-b1 needs to forward an HTTP port 80 segment to VM web-a1 sitting on host esx-a1. The process looks like this:
- VM win-b1 sends out a segment to the MAC address of win-a1.
- Host esx-b1 does a MAC cache check or MAC lookup on the controller assigned to VXLAN 5001. It sees that in order to get to 00:50:56:a6:8c:9f, it must forward the frame to VTEP 172.16.76.22.
- Host esx-b1 encapsulates the frame in an outer VXLAN UDP segment.
- The VXLAN UDP segment is sent to VTEP 172.16.76.22 but must be routed as the VTEPs are in different subnets.
- Host esx-a1 receives and decapsulates the frame from within the VXLAN segment.
- The frame is then delivered to the win-a1 VM.
Problem 2:
The second issue we have with RDP may look a lot more complex at the surface, but you’ll notice some commonalities as well. Below is the high level L3 diagram:
- The jump box VM (172.16.10.100) is northbound, so traffic is routed through the physical network to an Edge Services Gateway before entering the NSX infrastructure. In this case, it is esg-a2 for this traffic flow.
- esg-a2 has a route for the destination 172.17.1.0/24 network in it’s routing table. It’s next hop is the DLR LIF on the Transit VXLAN for this.
- The TCP 3389 segment is VXLAN encapsulated and forwarded to the DLR module on the same host esg-a2 is on. In this case, it happens to be host esx-a1.
- The esx-a1 host’s DLR module routes the segment to the ‘Blue Network’ VXLAN 5001 network. The packet is now ready for L2 delivery.
- The esx-a1 host will look up which VTEP it needs to forward the segment to in it’s VXLAN MAC table cache or via a NSX controller lookup. In this case, it knows that it must forward to the following VTEP:
nsx-controller # show control-cluster logical-switches mac-table 5001 VNI MAC VTEP-IP Connection-ID 5001 00:50:56:a6:09:02 172.16.76.22 2 5001 00:50:56:a6:0d:a2 172.16.30.82 7 5001 00:50:56:a6:c0:b0 172.16.76.22 2 5001 00:50:56:a6:c6:30 172.16.30.82 7 5001 00:50:56:a6:8c:9f 172.16.76.22 2 5001 00:50:56:a6:8e:2f 172.16.30.81 8 5001 00:50:56:a6:ad:0c 172.16.76.22 2 - Host esx-a1 now must forward the packet to esx-b1’s VTEP so that it can be delivered to the win-b1 VM. The esx-a1 host will forward a VXLAN encapsulated UDP segment to the destination VTEP 172.16.30.82. Because host esx-a1 and esx-b1’s VTEPs are in different subnets, the VXLAN segments will need to be routed to get to the destination VTEP.
- Host esx-b1 should now be able to decapsulate the inner frame from the UDP VXLAN segment and deliver the frame to the VM.
So what’s the common theme in both scenarios? It’s the delivery of the VXLAN segment between the compute-a and compute-b clusters. Each scenario has a different symptom, but this is the common denominator in both cases.
Troubleshooting the Underlay Network
Our current running theory is that there is a problem with VXLAN communication between clusters compute-a and compute-b.
Using the VXLAN network stack on the ESXi hosts, we must be able to communicate between all of the various VTEP addresses for a healthy underlay. More specifically, every host in every cluster of the transport zone must be able to communicate VTEP to VTEP.
I’m going to start by logging into the esx-b1 host via SSH and confirm this. The command I’ll be using is just a regular ‘ping’ with some extra flags. The ++netstack=vxlan option ensures that ESXi uses the VXLAN network stack and not the usual management stack. The -s 1572 option specifies a 1572 byte payload. This equates to a packet of exactly 1600 bytes. This is the minimum recommended MTU – 1550 bytes is the absolute required minimum. And finally, the -d option ensures the ‘do not fragment’ flag is set on the packet. This ensures that if a device along the way can’t satisfy the MTU requirement, the packet will be dropped rather than fragmented.
When I do this between esx-b1 and esx-b2, it works as expected:
[root@esx-b1:~] ping ++netstack=vxlan -s 1572 -d 172.16.30.81
PING 172.16.30.81 (172.16.30.81): 1572 data bytes
1580 bytes from 172.16.30.81: icmp_seq=0 ttl=64 time=0.556 ms
1580 bytes from 172.16.30.81: icmp_seq=1 ttl=64 time=1.114 ms
1580 bytes from 172.16.30.81: icmp_seq=2 ttl=64 time=1.048 ms

--- 172.16.30.81 ping statistics ---
3 packets transmitted, 3 packets received, 0% packet loss
round-trip min/avg/max = 0.556/0.906/1.114 ms
As you can see, this clearly fails when trying to ping any of compute-a’s VTEPs:
[root@esx-b1:~] ping ++netstack=vxlan -s 1572 -d 172.16.76.22
PING 172.16.76.22 (172.16.76.22): 1572 data bytes

--- 172.16.76.22 ping statistics ---
3 packets transmitted, 0 packets received, 100% packet loss
What if I adjust the ICMP payload size for a 1500 byte packet?
[root@esx-b1:~] ping ++netstack=vxlan -s 1472 -d 172.16.76.22
PING 172.16.76.22 (172.16.76.22): 1472 data bytes
1480 bytes from 172.16.76.22: icmp_seq=0 ttl=63 time=0.731 ms
1480 bytes from 172.16.76.22: icmp_seq=1 ttl=63 time=1.027 ms
1480 bytes from 172.16.76.22: icmp_seq=2 ttl=63 time=1.362 ms

--- 172.16.76.22 ping statistics ---
3 packets transmitted, 3 packets received, 0% packet loss
round-trip min/avg/max = 0.731/1.040/1.362 ms
It works. This tells me that somewhere along the L2/L3 data path, MTU is set to 1500, not the required 1550 or higher.
Next, let’s do a quick traceroute to confirm the data path:
[root@esx-b1:~] traceroute ++netstack=vxlan 172.16.76.22 -v
traceroute to 172.16.76.22 (172.16.76.22), 30 hops max, 40 byte packets
 1 172.16.30.1 (172.16.30.1) 48 bytes to 172.16.30.82 0.397 ms 0.253 ms 0.214 ms
 2 172.16.76.22 (172.16.76.22) 20 bytes to 172.16.30.82 0.618 ms 0.431 ms 0.422 ms
As per the diagram, we have one router and the destination. We’ll need to check four different locations:
- Switch/ports connecting to esx-b1
- Switch/ports connecting to esx-a1
- Router interface in VLAN 76
- Router interface in VLAN 30
The customer confirmed that all switches were set globally to 9000 MTU, so really the only thing left to check is the router.
Checking the VyOS configuration, it’s clear what the problem is:
vyos@vyos:~$ sh conf
interfaces {
 ethernet eth0 {
 duplex auto
 hw-id 00:0c:29:ce:ed:b8
 mtu 9000
 smp_affinity auto
 speed auto
<snip>
 vif 30 {
 address 172.16.30.1/24
 description "VLAN 30"
 mtu 1500
 }
 vif 76 {
 address 172.16.76.1/24
 description "VLAN 76"
 mtu 9000
It appears that someone forgot to increase the MTU of VLAN 30 when compute-b was deployed. It’s still at the default value of 1500 bytes.
Increasing this to 9000 to match should do the trick:
vyos@vyos# set interfaces ethernet eth0 vif 30 mtu 9000
[edit]
vyos@vyos# commit
[edit]
vyos@vyos# save
Saving configuration to '/config/config.boot'...
Done
Now let’s try to ping again from host esx-b1:
[root@esx-b1:~] ping ++netstack=vxlan -s 1572 -d 172.16.76.22
PING 172.16.76.22 (172.16.76.22): 1572 data bytes
1580 bytes from 172.16.76.22: icmp_seq=0 ttl=63 time=0.694 ms
1580 bytes from 172.16.76.22: icmp_seq=1 ttl=63 time=1.235 ms
1580 bytes from 172.16.76.22: icmp_seq=2 ttl=63 time=0.954 ms
Bingo! It works correctly now. Let’s try to access the web-a1 landing page again from win-b1:

RDP also functions now too!
Conclusion
And there you have it! Meeting the minimum MTU requirements for VXLAN networking is absolutely essential. NSX can extend logical switches across all manners of underlay networks – even over multiple hops, WANs and even through physical firewalls if configured correctly. But the one completely non-negotiable requirement is a 1550 or larger MTU. If that’s not in place, all bets are off.
What made this issue somewhat difficult to identify was the fact that diagnostic tools – like ping and telnet – worked just fine. It wasn’t until actual application traffic tried to traverse the VXLAN network that things fell apart. Regular ICMP echo requests and replies are very small packets – as are TCP SYN/SYN-ACK/ACK handshake segments. It’s not until the guest tries to send or receive a full size 1500 byte packet that traffic is lost. The VyOS router basically just dropped all of the 1600 byte VXLAN UDP segments. Smaller ones it had no issues with.
Hope you enjoyed this. If you have other suggestions for troubleshooting scenarios you’d like to see, please leave a comment or reach out to me on Twitter (@vswitchzero).

Thank you for putting together this problem / solution scenario.
Love it. I especially like how you explained your methodology to narrow the scope of the problem.
AWESOME! This article was very helpful in troubleshooting the almost exact same issue I had today. I never even thought to confirm the VTEPs were getting large frame across (since basic ping and SSH from my jumpbox to the nested ESXi node (on same VXLAN) worked already, only the Web UI to the ESXi node wasn’t responding)… all VTEPs were at 1600 mtu, both vDS were at 9000 mtu, all physical switchports were all 9216 mtu, but sure enough, my port channel between 2 switches, between those 2 clusters on the same NSX transport zone wasn’t set to 9216… I guess it is not enough that only the physical interface members of the port channel be set, but also the port channel itself must also be set to 9216… The ping command you demonstrated using both the 2 mtu sizes, revealed the same result as your demo, 1472 got through, but 1572 didn’t. This made me really surprised that basic ping and SSH putty were even working between the two systems, which is why I didn’t initially start on troubleshooting VTEPs.. THANKS, really appreciate the time you took to write this article!
Thanks, Oliver! Really glad it was helpful.