Thanks to everyone who took the time to comment on the first half of scenario 3, both here and on twitter. There were many great suggestions, and some were spot-on!
For more detail on the problem, some diagrams and other scoping information, be sure to check out the first half of scenario 3.
Getting Started
During the initial scoping in the first half, we didn’t really see too much out of the ordinary in the UI aside from some odd ‘red alarm’ exclamation marks on the compute-r hosts in the Host Preparation section.
More than one commenter pointed out that this needs to be investigated. I wholeheartedly agree. Despite seeing a green status for host VIB installation, firewall status and VXLAN, there is clearly still a problem. That problem is related to ‘Communication Channel Health’.
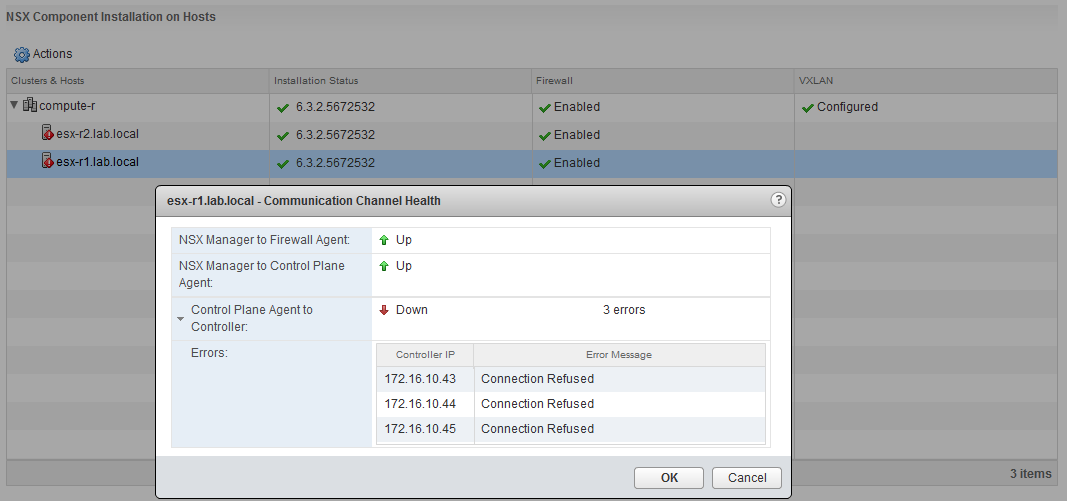
The communication channel health check was a new feature added in NSX 6.2 and makes it easy to see which hosts are having problems communicating with both NSX Manager and the Control Cluster. In our case, both esx-r1 and esx-r2 are reporting problems with their control plane agent (netcpa) to all three controllers.
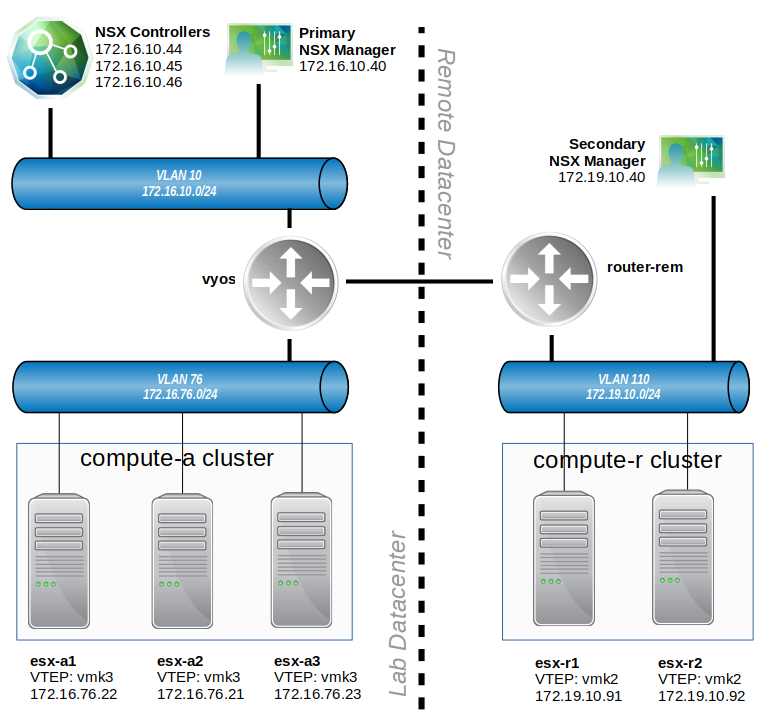
The hosts don’t appear to be having any problems communicating with NSX Manager, but remember, this is the secondary NSX manager at the remote location. The Universal Control Cluster (UCC) is located at the primary datacenter across the WAN.
This tells us there is a problem, but it really doesn’t tell us why.
A Closer Look
Now that we’ve established that there is a communication channel problem, let’s SSH into one of the compute-r hosts to take a look.
Before we start looking at the control plane, I want to ensure the management plane is working as it should be. The reason for this is because initially it’s NSX Manager that instructs the host how to communicate with the control cluster.
First, I’m checking to ensure the vsfwd service (vShield-Stateful-Firewall) is running on the host. This is used for the RabbitMQ management plane control channel communication to NSX manager:
[root@esx-r1:~] /etc/init.d/vShield-Stateful-Firewall status
vShield-Stateful-Firewall is running
Next, let’s make sure the host can communicate with the secondary NSX manager. We also want to ensure it’s got a RabbitMQ TCP 5671 connection established:
[root@esx-r1:~] ping 172.19.10.40
PING 172.19.10.40 (172.19.10.40): 56 data bytes
64 bytes from 172.19.10.40: icmp_seq=0 ttl=64 time=0.428 ms
64 bytes from 172.19.10.40: icmp_seq=1 ttl=64 time=0.630 ms
64 bytes from 172.19.10.40: icmp_seq=2 ttl=64 time=0.585 ms

--- 172.19.10.40 ping statistics ---
3 packets transmitted, 3 packets received, 0% packet loss
round-trip min/avg/max = 0.428/0.548/0.630 ms

[root@esx-r1:~] esxcli network ip connection list |grep 5671
tcp         0       0  172.19.10.21:32550  172.19.10.40:5671    ESTABLISHED     69027  newreno  vsfwd
tcp         0       0  172.19.10.21:42934  172.19.10.40:5671    ESTABLISHED     69027  newreno  vsfwd
tcp         0       0  172.19.10.21:42821  172.19.10.40:5671    ESTABLISHED     69027  newreno  vsfwd
[root@esx-r1:~]
Everything looks good on that front. Next, we’re going to look for some key configuration data that NSX Manager sends to prepared hosts. During host preparation, NSX manager will push this data to the /etc/vmware/netcpa/config-by-vsm.xml file.
<config>
  <connectionList>
    <connection id="0000">
      <port>1234</port>
      <server>172.16.10.43</server>
      <sslEnabled>true</sslEnabled>
      <thumbprint>6B:85:66:C4:47:7D:A2:16:53:87:AC:A5:20:F4:16:E1:BC:BF:3E:68</thumbprint>
    </connection>
    <connection id="0002">
      <port>1234</port>
      <server>172.16.10.44</server>
      <sslEnabled>true</sslEnabled>
      <thumbprint>85:5C:BB:1B:F5:BB:5C:6D:41:FA:73:3B:65:D7:97:67:2C:12:11:70</thumbprint>
    </connection>
    <connection id="0003">
      <port>1234</port>
      <server>172.16.10.45</server>
      <sslEnabled>true</sslEnabled>
      <thumbprint>E3:BF:EC:10:C3:A8:64:48:80:3B:A5:BB:55:82:0E:CE:C5:AA:93:CD</thumbprint>
    </connection>
  </connectionList>
  <localeId>
    <id>122636AB-6236-7984-9402-2ACAAD20270E</id>
  </localeId>
  <vdrDvsList>
    <vdrDvs id="0000">
      <numActiveUplink>1</numActiveUplink>
      <numUplink>2</numUplink>
      <teamingPolicy>FAILOVER_ORDER</teamingPolicy>
      <uplinkPortNames>Uplink 2,Uplink 1</uplinkPortNames>
      <uuid>50 2b 64 b1 a3 78 3a e9-02 8f 67 f6 59 8a 4f 99</uuid>
      <vxlanOnly>true</vxlanOnly>
    </vdrDvs>
  </vdrDvsList>
  <vdrInstanceList>
    <vdrInstance id="0000">
      <isUniversal>true</isUniversal>
      <localEgressRequired>false</localEgressRequired>
      <vdrId>10000</vdrId>
      <vdrName>default+edge-21a92040-3d25-41d2-8681-2900ae5159f3</vdrName>
    </vdrInstance>
  </vdrInstanceList>
</config>
There are several important configuration items stored in this file including the locale ID that’s used for local egress, DLR instance names and distributed switch information. What we are most interested in, however, is the list of controllers that should be used by this host. This file essentially instructs the host’s netcpa process to try to establish connections to these listed controllers. Without this data, the host won’t even know how to try.
The Control Plane Agent
Now that we know the host is talking to NSX Manager and pulled down the correct controller config data, let’s have a look at host to controller communication.
First things first – we’ll ensure the netcpa process is running on this host:
[root@esx-r1:~] /etc/init.d/netcpad status
netCP agent service is running
Next, let’s do a simple ping test to determine if the controllers are reachable from an L3 perspective. Remember, we don’t want to use the VXLAN network stack or the VTEP kernel ports for this purpose. Control plane agent connectivity is handled through the default netstack instance and the host’s management network kernel port. Just a ‘regular’ ping is appropriate here:
[root@esx-r1:~] ping 172.16.10.43
PING 172.16.10.43 (172.16.10.43): 56 data bytes
64 bytes from 172.16.10.43: icmp_seq=0 ttl=62 time=0.952 ms
64 bytes from 172.16.10.43: icmp_seq=1 ttl=62 time=0.891 ms
64 bytes from 172.16.10.43: icmp_seq=2 ttl=62 time=1.193 ms

--- 172.16.10.43 ping statistics ---
3 packets transmitted, 3 packets received, 0% packet loss
round-trip min/avg/max = 0.891/1.012/1.193 ms

[root@esx-r1:~] ping 172.16.10.44
PING 172.16.10.44 (172.16.10.44): 56 data bytes
64 bytes from 172.16.10.44: icmp_seq=0 ttl=62 time=0.964 ms
64 bytes from 172.16.10.44: icmp_seq=1 ttl=62 time=1.201 ms
64 bytes from 172.16.10.44: icmp_seq=2 ttl=62 time=1.090 ms

--- 172.16.10.44 ping statistics ---
3 packets transmitted, 3 packets received, 0% packet loss
round-trip min/avg/max = 0.964/1.085/1.201 ms

[root@esx-r1:~] ping 172.16.10.45
PING 172.16.10.45 (172.16.10.45): 56 data bytes
64 bytes from 172.16.10.45: icmp_seq=0 ttl=62 time=1.299 ms
64 bytes from 172.16.10.45: icmp_seq=1 ttl=62 time=1.095 ms
64 bytes from 172.16.10.45: icmp_seq=2 ttl=62 time=0.968 ms

--- 172.16.10.45 ping statistics ---
3 packets transmitted, 3 packets received, 0% packet loss
round-trip min/avg/max = 0.968/1.121/1.299 ms
Interestingly, all three controllers are reachable. This may be surprising, but just because ICMP echo requests and replies are making it through doesn’t necessarily mean that we’re establishing a TCP connection. Let’s check the netcpa agent to controller connections on TCP port 1234:
[root@esx-r1:~] esxcli network ip connection list |grep 1234
tcp         0       0  172.19.10.21:12537  172.16.10.43:1234    SYN_SENT        67768  newreno  netcpa-worker
tcp         0       0  172.19.10.21:13057  172.16.10.44:1234    SYN_SENT        67684  newreno  netcpa-worker
tcp         0       0  172.19.10.21:40328  172.16.10.45:1234    SYN_SENT        67682  newreno  netcpa-worker
Bingo! We see three incomplete TCP sockets listed – one to each controller node. The status ‘SYN_SENT’ indicates that the host sent a SYN flagged segment for connection establishment but never got a reply. If things were working correctly, the status should read ‘ESTABLISHED’.
This confirms what the UI reported to us – control plane agents are not able to communicate to the control cluster. We also know that L3 connectivity is good to those IPs, but a TCP session can’t be established.
What is the Impact?
Knowing that the control plane is down, I’d like to know exactly what the host thinks the current state of the VXLAN fabric is, as well as DLR instances associated with the universal transport zone. If the control plane has never been up, it’s quite likely that the host has no knowledge of any VXLAN networks or DLR instances. Let’s check:
[root@esx-r1:~] net-vdl2 -l
VXLAN Global States:
        Control plane Out-Of-Sync:      No
        UDP port:       4789
VXLAN VDS:      dvs-rem
        VDS ID: 50 2b 64 b1 a3 78 3a e9-02 8f 67 f6 59 8a 4f 99
        MTU:    1600
        Segment ID:     172.19.10.0
        Gateway IP:     172.19.10.1
        Gateway MAC:    00:50:56:a6:ca:3f
        Vmknic count:   1
                VXLAN vmknic:   vmk2
                        VDS port ID:    12
                        Switch port ID: 50331655
                        Endpoint ID:    0
                        VLAN ID:        0
                        IP:             172.19.10.91
                        Netmask:        255.255.255.0
                        Segment ID:     172.19.10.0
                        IP acquire timeout:     0
                        Multicast group count:  0
        Network count:  0
As you can see, the network count is zero. The host only knows about its VTEP that was created during initial host preparation. It doesn’t look like the controllers pushed down any of the VXLAN information. This fact alone tells us that the VMs in any of the portgroups associated with logical switches on this host would be broken. It certainly matches the symptoms.
You may be wondering why ‘Control plane Out-Of-Sync’ says ‘No’ even though we are clearly not talking to the controllers. This will change to ‘Yes’ if the data on the host doesn’t match what’s on the controllers. Right now it has no idea what’s even on the controllers so it has nothing to compare against.
We can also check to see if any DLR instances made it down to the host. Each DLR instance is handled by one of the three nodes:
[root@esx-r1:~] net-vdr -I -l

VDR Instance Information :
---------------------------
Vdr Name:                   default+edge-21a92040-3d25-41d2-8681-2900ae5159f3
Vdr Id:                     0x00002710
Number of Lifs:             0
Number of Routes:           0
Number of Neighbors:        0
State:                      Enabled Universal
Controller IP:              0.0.0.0
Control Plane IP:           0.0.0.0
Control Plane Active:       No
Num unique nexthops:        0
Generation Number:          0
Edge Active:                No
The universal DLR instance did indeed make it down to the host, but that’s because it’s contained in the config-by-vsm.xml file. NSX Manager has made the host aware of the instance, but the host has no idea which controller is responsible for this DLR instance (0.0.0.0 listed).
This means that the DLR likely has no routes in it’s routing table:
[root@esx-r1:~] net-vdr -R -l default+edge-21a92040-3d25-41d2-8681-2900ae5159f3

VDR default+edge-21a92040-3d25-41d2-8681-2900ae5159f3 Route Table
Legend: [U: Up], [G: Gateway], [C: Connected], [I: Interface]
Legend: [H: Host], [F: Soft Flush] [!: Reject] [E: ECMP]

[root@esx-r1:~]
As expected, the table is empty. We know that there were numerous routes on the DLR control appliance, but these can only get pushed to the host via the control plane connection.
We know that because of this problem there will be two separate problems:
- VMs in compute-r will not be able to communicate with each other on any logical switches. Only VMs on the same host and same portgroup will be able to communicate.
- VMs in compute-r will not have any DLR routing. This means there will be no east-west routing between logical switches, nor will there be any way to get to the northbound ESG.
This matches the symptoms that the customer reported.
The Search for Root Cause
Although I suspect some kind of communication problem, let’s see what /var/log/vsfwd.log has to say:
2018-01-15T15:31:39.432Z info netcpa[4219B70] [Originator@6876 sub=Default] Core: Sharding connection 172.16.10.44:0 is timeout
2018-01-15T15:31:39.433Z info netcpa[4219B70] [Originator@6876 sub=Default] App CORE : 0 unregister connection to 172.16.10.44:0
2018-01-15T15:31:39.433Z info netcpa[4219B70] [Originator@6876 sub=Default] Connection 172.16.10.44:0 is not removed, still used by 1 users
2018-01-15T15:31:39.433Z info netcpa[4219B70] [Originator@6876 sub=Default] App CORE : 0 register connection to existing controller to 172.16.10.43 port 1234
2018-01-15T15:31:54.435Z info netcpa[4011B70] [Originator@6876 sub=Default] Core: Sharding connection 172.16.10.43:0 is timeout
2018-01-15T15:31:54.435Z info netcpa[4011B70] [Originator@6876 sub=Default] App CORE : 0 unregister connection to 172.16.10.43:0
2018-01-15T15:31:54.435Z info netcpa[4011B70] [Originator@6876 sub=Default] Connection 172.16.10.43:0 is not removed, still used by 1 users
2018-01-15T15:31:54.435Z info netcpa[4011B70] [Originator@6876 sub=Default] App CORE : 0 register connection to existing controller to 172.16.10.44 port 1234
2018-01-15T15:32:01.547Z error netcpa[40D4B70] [Originator@6876 sub=Default] Cannot connect to the server 172.16.10.45:0
2018-01-15T15:32:09.436Z info netcpa[40D4B70] [Originator@6876 sub=Default] Core: Sharding connection 172.16.10.44:0 is timeout
2018-01-15T15:32:09.436Z info netcpa[40D4B70] [Originator@6876 sub=Default] App CORE : 0 unregister connection to 172.16.10.44:0
2018-01-15T15:32:09.436Z info netcpa[40D4B70] [Originator@6876 sub=Default] Connection 172.16.10.44:0 is not removed, still used by 1 users
2018-01-15T15:32:09.437Z info netcpa[40D4B70] [Originator@6876 sub=Default] App CORE : 0 register connection to existing controller to 172.16.10.43 port 1234
It seems pretty clear that the host is making an effort, but simply cannot connect to the controllers due to a timeout.
To narrow the problem down, I’ll do a packet capture to see if TCP 1234 segments are leaving host esx-r1, and whether they are making it to the controller at the primary datacenter.
I started by taking a capture of TCP 1234 traffic leaving the management vmkernel port on host esx-r1 using the following syntax:
[root@esx-r1:/var/log] pktcap-uw --vmk vmk0 --tcpport 1234 --dir 0 -o /tmp/cap.pcap
The name of the vmk is vmk0
The session filter TCP port(src/dst) is 1234
The dir is Input
The output file is /tmp/cap.pcap
No server port specifed, select 36597 as the port
Local CID 2
Listen on port 36597
Accept...Vsock connection from port 1028 cid 2
Dump: 16, broken : 0, drop: 0, file err: 0

Dumped 16 packet to file /tmp/cap.pcap, dropped 0 packets.

Done.
As expected, we can see that the host is indeed sending SYN segments to the controller 172.16.10.45 out of the management kernel port:
[root@esx-r1:/var/log] tcpdump-uw -nr /tmp/cap.pcap |grep -i 172.16.10.45
reading from file /tmp/cap.pcap, link-type EN10MB (Ethernet)
16:33:56.347995 IP 172.19.10.21.62319 > 172.16.10.45.1234: Flags [S], seq 3475633359, win 65535, options [mss 1460,sackOK,eol], length 0
16:34:17.870335 IP 172.19.10.21.32140 > 172.16.10.45.1234: Flags [S], seq 1078665921, win 65535, options [mss 1460,nop,wscale 9,sackOK,TS val 35479915 ecr 0], length 0
16:34:20.877821 IP 172.19.10.21.32140 > 172.16.10.45.1234: Flags [S], seq 1078665921, win 65535, options [mss 1460,nop,wscale 9,sackOK,TS val 35480216 ecr 0], length 0
16:34:28.214118 IP 172.19.10.21.35907 > 172.16.10.45.1234: Flags [S], seq 457039472, win 65535, options [mss 1460,nop,wscale 9,sackOK,TS val 35480949 ecr 0], length 0
16:34:31.217774 IP 172.19.10.21.35907 > 172.16.10.45.1234: Flags [S], seq 457039472, win 65535, options [mss 1460,nop,wscale 9,sackOK,TS val 35481250 ecr 0], length 0
16:34:34.427726 IP 172.19.10.21.35907 > 172.16.10.45.1234: Flags [S], seq 457039472, win 65535, options [mss 1460,nop,wscale 9,sackOK,TS val 35481571 ecr 0], length 0
16:34:37.637752 IP 172.19.10.21.35907 > 172.16.10.45.1234: Flags [S], seq 457039472, win 65535, options [mss 1460,nop,wscale 9,sackOK,TS val 35481892 ecr 0], length 0
16:34:40.847770 IP 172.19.10.21.35907 > 172.16.10.45.1234: Flags [S], seq 457039472, win 65535, options [mss 1460,nop,wscale 9,sackOK,TS val 35482213 ecr 0], length 0
16:34:44.057748 IP 172.19.10.21.35907 > 172.16.10.45.1234: Flags [S], seq 457039472, win 65535, options [mss 1460,nop,wscale 9,sackOK,TS val 35482534 ecr 0], length 0
I then did a similar capture on the management host at the primary datacenter with the 172.16.10.45 controller node on it.
[root@esx0:~] pktcap-uw --switchport 33554449 --tcpport 1234 --dir 1 -o /tmp/cap.pcap
The switch port id is 0x02000011
The session filter TCP port(src/dst) is 1234
The dir is Output
The output file is /tmp/cap.pcap
No server port specifed, select 3189 as the port
Local CID 2
Listen on port 3189
Accept...Vsock connection from port 1029 cid 2
Dump: 184, broken : 0, drop: 0, file err: 0

Dumped 184 packet to file /tmp/cap.pcap, dropped 0 packets.

Done.
Although a fair number of TCP 1234 segments were captured, not a single one arrived from a host in the 172.19.10.0/24 network:
[root@esx0:~] tcpdump-uw -nr /tmp/cap.pcap |grep -i 172.19
reading from file /tmp/cap.pcap, link-type EN10MB (Ethernet)
[root@esx0:~]
We can see communication from the hosts in compute-a with this controller node, but again, nothing fromcompute-r in the 172.19.10.0/24 subnet:
[root@esx0:~] tcpdump-uw -nr /tmp/cap.pcap |grep -i 172.16
reading from file /tmp/cap.pcap, link-type EN10MB (Ethernet)
16:40:08.044870 IP 172.16.10.21.20129 > 172.16.10.45.1234: Flags [P.], seq 1229532845:1229532884, ack 239022465, win 128, length 39
16:40:10.312818 IP 172.16.10.21.20129 > 172.16.10.45.1234: Flags [.], ack 40, win 128, length 0
16:40:18.051584 IP 172.16.10.21.20129 > 172.16.10.45.1234: Flags [P.], seq 39:78, ack 40, win 128, length 39
16:40:20.303956 IP 172.16.10.21.20129 > 172.16.10.45.1234: Flags [.], ack 79, win 128, length 0
<snip>
To take this a step further, you could also repeat the captures at the physical uplinks on both hosts to prove the segment is leaving/entering the host. This would have been even better to prove that the problems is on the physical network. None the less, this points us in the right direction.
If the host is sending the SYN, but the controller node never receives it – it must be getting dropped somewhere along the data path.
Let’s take another quick look at the diagram posted in the first half:
[root@esx-r1:~] traceroute -i vmk0 172.16.10.45
traceroute to 172.16.10.45 (172.16.10.45), 30 hops max, 40 byte packets
 1  172.19.10.1 (172.19.10.1)  0.362 ms  0.164 ms  0.137 ms
 2  172.31.255.1 (172.31.255.1)  0.253 ms  0.194 ms  0.221 ms
 3  controller-3.lab.local (172.16.10.45)  0.833 ms  0.482 ms  0.366 ms
Looking at a traceroute and the diagram in the first half, we can see that router-rem (172.19.10.1) is the first hop in the data path. In discussing with our fictional customer, we were able to learn that in addition to routing, this device is also a firewall.
The customer reports that the required ports were opened for the primary and secondary NSX manager to communicate, as well as UDP 4789 for VTEPs between the primary and secondary datacenter. The customer does not believe they made any provisions for TCP port 1234 on router-rem.
The Fix
After consulting with the security administrator, rule 10 was added to the firewall to allow destination TCP 1234 between the datacenters:
vyos@vyos-rem:~$ show conf
<snip>
rule 10 {
            action accept
            description "accept TCP 1234"
            destination {
                address 172.16.0.0/16
                port 1234
            }
            protocol tcp
            source {
                address 172.19.0.0/16
            }
            tcp {
            }
        }
<snip>
Within a few minutes, control plane connectivity was established and the errors in the UI cleared:
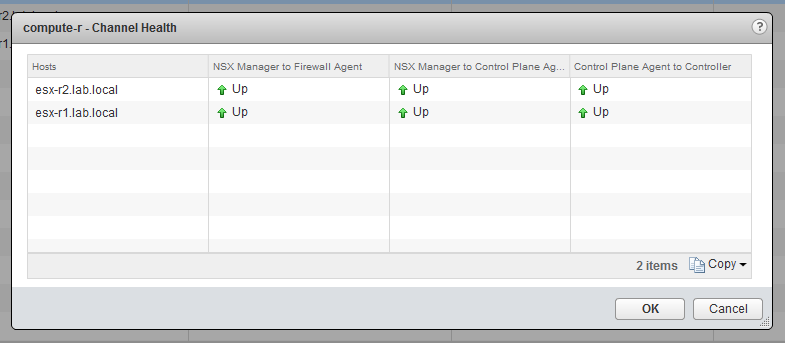
We can also see that we now have healthy TCP socket connections via TCP 1234:
[root@esx-r2:~] esxcli network ip connection list |grep -i 1234
tcp         0       0  172.19.10.22:41329  172.16.10.43:1234    ESTABLISHED   2685312  newreno  netcpa-worker
tcp         0       0  172.19.10.22:15742  172.16.10.45:1234    ESTABLISHED   2685325  newreno  netcpa-worker
Keep in mind that because we don’t have many VMs or DLR routing instances online yet, this host only needed two controller connections.
VXLAN networks were now pulled down, and we can see both the transit and test logical switches:
[root@esx-r2:~] net-vdl2 -l
VXLAN Global States:
        Control plane Out-Of-Sync:      No
        UDP port:       4789
VXLAN VDS:      dvs-rem
        VDS ID: 50 2b 64 b1 a3 78 3a e9-02 8f 67 f6 59 8a 4f 99
        MTU:    1600
        Segment ID:     172.19.10.0
        Gateway IP:     172.19.10.1
        Gateway MAC:    00:50:56:a6:ca:3f
        Vmknic count:   1
                VXLAN vmknic:   vmk2
                        VDS port ID:    19
                        Switch port ID: 50331655
                        Endpoint ID:    0
                        VLAN ID:        0
                        IP:             172.19.10.92
                        Netmask:        255.255.255.0
                        Segment ID:     172.19.10.0
                        IP acquire timeout:     0
                        Multicast group count:  0
        Network count:  2
                VXLAN network:  10000
                        Multicast IP:   N/A (headend replication)
                        Control plane:  Enabled (multicast proxy,ARP proxy)
                        Controller:     172.16.10.45 (up)
                        Controller Disconnected Mode: no
                        MAC entry count:        0
                        ARP entry count:        0
                        Port count:     3
                VXLAN network:  10001
                        Multicast IP:   0.0.0.0
                        Control plane:  Inactive
                        MAC entry count:        0
                        ARP entry count:        0
                        Port count:     1
We also have a full DLR routing table that is consistent with the control appliance as well:
[root@esx-r2:~] net-vdr -R -l default+edge-21a92040-3d25-41d2-8681-2900ae5159f3

VDR default+edge-21a92040-3d25-41d2-8681-2900ae5159f3 Route Table
Legend: [U: Up], [G: Gateway], [C: Connected], [I: Interface]
Legend: [H: Host], [F: Soft Flush] [!: Reject] [E: ECMP]

Destination      GenMask          Gateway          Flags    Ref Origin   UpTime     Interface
-----------      -------          -------          -----    --- ------   ------     ---------
10.40.0.0        255.255.255.128  172.20.0.1       UG       1   AUTO     480        271000000002
172.16.10.0      255.255.255.0    172.20.0.1       UG       1   AUTO     480        271000000002
172.16.11.0      255.255.255.0    172.20.0.1       UG       1   AUTO     480        271000000002
172.16.12.0      255.255.255.0    172.20.0.1       UG       1   AUTO     480        271000000002
172.16.13.0      255.255.255.0    172.20.0.1       UG       1   AUTO     480        271000000002
172.16.14.0      255.255.255.0    172.20.0.1       UG       1   AUTO     480        271000000002
172.16.76.0      255.255.255.0    172.20.0.1       UG       1   AUTO     480        271000000002
172.16.77.0      255.255.255.0    172.20.0.1       UG       1   AUTO     480        271000000002
172.17.0.0       255.255.255.192  172.20.0.1       UG       1   AUTO     480        271000000002
172.17.1.0       255.255.255.0    172.20.0.1       UG       1   AUTO     480        271000000002
172.17.2.0       255.255.255.0    172.20.0.1       UG       1   AUTO     480        271000000002
172.17.3.0       255.255.255.0    172.20.0.1       UG       1   AUTO     480        271000000002
172.17.4.0       255.255.255.0    172.20.0.1       UG       1   AUTO     480        271000000002
172.17.5.0       255.255.255.0    172.20.0.1       UG       1   AUTO     480        271000000002
172.19.10.0      255.255.255.0    172.20.0.1       UG       1   AUTO     480        271000000002
172.20.0.0       255.255.255.0    0.0.0.0          UCI      1   MANUAL   480        271000000002
172.20.1.0       255.255.255.0    0.0.0.0          UCI      1   MANUAL   480        27100000000a
172.30.30.30     255.255.255.255  172.20.0.1       UGH      1   AUTO     480        271000000002
172.31.255.0     255.255.255.192  172.20.0.1       UG       1   AUTO     480        271000000002
Conclusion
Understanding how the various NSX management and control plane components communicate is critical to effective troubleshooting. Thanks again to everyone for posting their testing suggestions and theories! The active discussion made this one a lot more interesting.
I hope you enjoyed this scenario. If you have other suggestions for troubleshooting scenarios you’d like to see, please leave a comment, or reach out to me on Twitter (@vswitchzero).
